Income
Income
The median household income before tax was $64,797 for all Middlesex-London households in 2015. This was $9,490 lower than the median for Ontario ($74,287).
When after-tax median income is considered, the median household income for Middlesex-London was $57,589. This was $7,696 lower than the median for Ontario ($65,285); tax redistribution having closed the income gap slightly between Middlesex-London and Ontario.
Middlesex-London’s after-tax median income increased by 1.4% from 2005, when it was $56,814 (calculated in 2015 constant dollars for comparisons)1.
Median after-tax household income was lower for male lone-parent families ($54,089) and female lone parent families ($43,474) in Middlesex-London and for people not living in a census family (i.e., living alone or in a group of two or more unrelated people who live together in a household. For example, a group of students or friends are not considered a census family) ($33,002) (Figure 2.3.1).
Maps of the County of Middlesex and the City of London of median after-tax household income indicate variation in areas from less than $50,000 to $110,000 or more (Figure 2.3.2 and Figure 2.3.3).
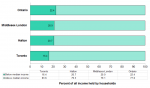
Income share is one way to look at income inequality within a population. Middlesex-London had a household income share of 20.9% in 2015, indicating that the half of the households with incomes below the median (i.e., below $64,797 for Middlesex-London) collectively made 20.9% of all the household income and the other half of households shared 79.1% of the total income. A percent of 50% would represent equality (Figure 2.3.4).
Middlesex-London’s income share was lower than Ontario (22.4%) indicating that the distribution of income in Middlesex-London was more unequal than Ontario overall. Middlesex-London was also the third most unequal health unit in Ontario in terms of income share behind Toronto (16.4) and Halton (20.7) (Figure 2.3.4).
Middlesex-London’s income share has become more unequal over the past decade, down 1.4% from 21.3% in 2005. During this same time period, Ontario’s income share became slightly more equal, increasing 1.6% from 20.8% in 2005. 2
The percent of the population living below the poverty line was 15.0% Middlesex-London in 2015; higher compared to Ontario overall (13.9%) (Figure 2.3.5). This is based on the Market Basket Measure, Canada’s new official poverty line.3,4
A similar percent of females (15.1%) and males (14.9%) were living below the poverty line in Middlesex-London (Figure 2.3.5).
Younger age groups, particularly children aged zero to four (21.1%) and young adults aged 20 to 24 (27.2%) were more likely to be below the poverty line than older age groups (e.g., adults aged 25 to 64; 14.0%) (Figure 2.3.6). While 6.3% of seniors aged 65 and older were living below the poverty line, generally, seniors in Middlesex-London were doing slightly better than Ontario seniors (8.1%).
The population living below the poverty line is also different than the general population with regards to education and employment status.
Those without postsecondary education (no certificate, 29.6%; secondary school diploma, 16.2%) were more likely than those with postsecondary education (10.8%) to be living in poverty (Figure 2.3.5).
People aged 25 to 64, who were not in the labour force (21.7%) or who were unemployed (28.0%) were more likely to be living in poverty than those that were employed (8.4%) (Figure 2.3.5).
Maps indicate the percent of people living below the poverty line by area ranging from less than or equal to 5% to greater than 20%. (Figure 2.3.7 and Figure 2.3.8).
Maps of the County of Middlesex and the City of London of material deprivation indicate areas of concentration within the County and the City. (Figure 2.3.9 and Figure 2.3.10).
Income and income distribution is considered a key determinant of health.5 Higher levels of income have been linked with improved health outcomes and healthier behaviours.6 Income is not evenly distributed within Middlesex-London. The data indicates that income inequality may be increasing in Middlesex-London. This could lead to increased health inequities that are associated with social disadvantages that are modifiable and considered unfair.
Canada’s official poverty line is based on what is known as the Market Basket Measure (MBM). A household is considered to be in low income if it does not have enough money to buy a specific basket of goods and services that allows them to meet their basic needs and achieve a modest standard of living in their community. A key feature of the MBM is that it is more sensitive than other low-income measures to geographical variations in the cost of many typical items of expenditure.4 Taken into consideration are the costs of specified qualities and quantities of food, clothing, footwear, transportation, shelter and other expenses for a reference family of two adults aged 25 to 49 and two children aged 9 and 13. This measure distinguishes between having and not having enough money to purchase a fixed basket of goods and services, so it is an absolute measure of poverty.3
Material deprivation is an area-based summary measure that is closely connected to poverty and it refers to the inability for individuals and communities to access and attain basic material needs. The indicators included in this dimension measure income, unemployment quality of housing, educational attainment and family structure characteristics. It is one of the components of the Ontario Marginalization Index (ONMarg) and can be used in combination with area-based health data to assess neighbourhood-level need and monitor health inequalities. 6


, Middlesex-London and Ontario, 2015")
, Middlesex-London and Ontario, 2015")
 by dissemination area")
 by dissemination area")


Ontario Public Health Standards: Requirements for Programs, Services, and Accountability
Population Health Assessment and Surveillance Protocol, 2018
References:
1.Statistics Canada. Income highlight tables, 2016 census [Internet]. Ottawa (ON): Statistics Canada; 2017 Sept. Median household total income and after-tax income by household type (total – household type including census family structure), Canada and census divisions, 2016 Census – 100% data, 2006 census – 20% sample data; [modified 2017 Sept 11; cited 2019 Feb 20]; [about 3 screens]. Available from: https://www12.statcan.gc.ca/census-recensement/2016/dp-pd/hlt-fst/inc-re... Catalogue no. 98-402-X2016006
2. Statistics Canada [Internet]. Ottawa (ON): Statistics Canada; [modified 2019 Feb 22]. Table 17-10-0100-01 census indicator profile, Canada, provinces, territories, health regions (2011 boundaries) and peer groups; [updated 2019 Feb 20, cited 2019 Feb 20]. [about 6 screens]. Available from: https://www150.statcan.gc.ca/t1/tbl1/en/tv.action?pid=1710010001
3. Government of Canada, Employment and Social Development Canada. Opportunity for all – Canada's first poverty reduction strategy [Internet]. Ottawa (ON): Her Majesty the Queen in Right of Canada; 2018 [cited 2019 Feb 20]. 112 p. Available at: https://www.canada.ca/en/employment-social-development/programs/poverty-...
4. Dictionary, Census of Population, 2016 [Internet]. Ottawa (ON): Statistics Canada; 2016 Nov [updated 2017 Nov]. Market basket measure (MBM); 2017 May [updated 2017 Sep 13; cited 2019 Feb 20]; [about 3 screens]. Available from: https://www12.statcan.gc.ca/census-recensement/2016/ref/dict/pop165-eng.cfm
5. Ontario Ministry of Health and Long-Term Care. Health equity guideline [Internet]. Toronto (ON): Queen’s Printer for Ontario; 2018 [cited 2019 Feb 9]. 20 p. Available from: http://www.health.gov.on.ca/en/pro/programs/publichealth/oph_standards/d...
6. Ontario Ministry of Health and Long-Term Care. Improving the odds: championing health equity in Ontario – 2016 annual report of the Chief Medical Officer of Health of Ontario to the legislative assembly of Ontario [Internet]. Toronto (ON): Queen’s Printer for Ontario; 2018 Feb [ cited 2019 Feb 20]. 27 p. Available from: http://www.health.gov.on.ca/en/common/ministry/publications/reports/cmoh...
7. Matheson, FI; Ontario Agency for Health Protection and Promotion (Public Health Ontario). 2016 Ontario marginalization index: user guide. Toronto, ON: Providence St. Joseph’s and St. Michael’s Healthcare; 2018. Joint publication with Public Health Ontario. [cited 2019 Feb 20] Available from: https://www.publichealthontario.ca/en/eRepository/userguide-on-marg.pdf
Last modified on: March 18, 2019
Jargon Explained
Median household income
is the level of income at which half the households had higher income and half had lower. After-tax income better reflects the redistributive impact of Canada's tax/ transfer system.
Income share
is one way to look at income inequality. It is the share of income held by the half of all households whose incomes fall below the median household income. A percent of 0% would represent complete inequality and a percent of 50% would represent equality.
Market Basket Measure
is a measure of low-income and has been identified as Canada’s official poverty line. It defines the cost of purchasing a specified basket of goods and services to enjoy a modest, basic standard of living.
Material deprivation
is an area (neighbourhood) based summary measure that simultaneously assesses the neighbourhood’s education, employment, income, housing conditions and family structure.