Employment
Employment
There has been a steady decline for over a decade in the participation of those 15 years and older in the labour force. Labour force participation rates in the London Economic Region have declined from the 2004 high of 70.6% to 62.0% in 2018.1 Ontario’s participation rate declined to a smaller degree from 68.4% to 64.5% over the same 15-year time period. While the 2008-09 recession may have had an impact on the participation rate by discouraging some from looking for work and influencing others to return to school or stay in school longer, it is generally accepted that the decline began before the recession and is largely due to the aging of the workforce and the impact of early retirements.2,3
The annual unemployment rate was 5.8% in Middlesex-London for residents aged 15 and over in the labour force according to the Labour Force Survey in 2017 (Figure 2.2.1).
Unemployment recently returned to the levels experienced prior to the Canadian recession of 2008-09; it decreased from a high of 9.2% in 2009 to 5.8% in 2017 (Figure 2.2.1).
Unemployment in both Middlesex-London and the broader London Economic Region followed a similar pattern to Ontario over time. Unemployment rates in Middlesex-London rose above Ontario’s rates following the recession and remained there until 2015, when they levelled off slightly below Ontario’s rate (Figure 2.2.1).
Youth unemployment (aged 15-25) was higher (10.5%) compared to all those aged 15 and over (5.8%) in Middlesex-London in 2017 and slightly lower than Ontario’s youth unemployment rate (12.3%) in 2017 (Figure 2.2.2).
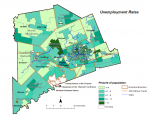
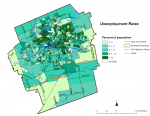
Maps show how levels of unemployment varied within Middlesex-London and the City of London from less than or equal to 4% to more than 11% according to the 2016 Census (Figure 2.2.3 and Figure 2.2.4).
Eight out of nine (81.7%) Middlesex-London residents that were aged 15 and older in the labour force had a usual place of work according to the 2016 Census. This was similar to Ontario (81.0%). More females (87.0%) than males (76.5%) had a usual place of work. A much higher percent of males (15.6%) than females (5.9%) had no fixed address for work; examples of those with no fixed work address include construction crews, truck drivers, salespersons, independent contractors or temporary agency employees (Figure 2.2.5). The percent working with no fixed address has increased slightly in Middlesex-London since 2006 when it was 13.2% of males and 4.5% of females. 4
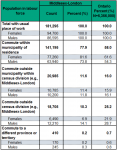
Just over one in five residents, aged 15 and older, in the labour force, in Middlesex-London (22.1%) regularly worked outside of the municipality in which they lived, compared to two in five (42.0%) in Ontario. This has increased only slightly from a decade ago when it was 21.1% of the Middlesex-London population and 40.0% of the Ontario population who regularly worked outside the municipality in which they lived according to the 2006 Census (Figure 2.2.6).
Commuters in the Middlesex-London area in 2016 came primarily from Middlesex-London itself (162,175). However, there were also 22,935 commuters that come from outside of Middlesex-London to Middlesex-London as their usual place of work. Three-quarters of those who commute in come from the surrounding areas of: Elgin (9,920), Oxford (3,950), Lambton (2,200), Huron (1,010) and Perth (815). 5
Similarly, Middlesex-London residents commuted for work in 2016 primarily within Middlesex-London (162,175). However, a small number (18,790) also commute out. Over 80% commute out to their usual place of work in Oxford (5,280), Elgin (3,810), Perth (1,990), Lambton (1,380), Huron (1,135), Toronto (1,055) and Waterloo (900). 5
Males (26.2%) were more likely than females (18.4%) to work outside of their municipality of residence in Middlesex-London in 2016 (Figure 2.2.6).
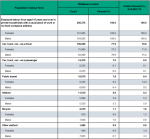
Over three quarters (77.5%) of residents, aged 15 and older, in the labour force, in Middlesex-London drove to work on a regular basis, slightly less than the 79.9% of Ontarians (Fig. 2.2.7).
Active transportation, such as walking or cycling, was the mode of transportation to get to work by 6.7% of those residents of Middlesex-London that had a usual place of work. This was similar to Ontario (6.9%) (Fig. 2.2.7). This is down slightly within Middlesex-London from a decade ago when it was 7.6%, while Ontario remained similar to 2006 when it was 6.8%. 4
Employment, along with job security, and working conditions are considered a key determinant of health.6 The unemployment rate is a traditional measure of the economy. Unemployment can be both a cause and a consequence of ill health and unemployed people tend to experience more health problems. 7
The journey to work and commuting issues are an important component of community design and transportation policy and, in turn, can affect the population’s health and the environment.8 Long commutes are associated with poor health outcomes and can put a strain on family relationships. Environmentally, greater use of sustainable transportation means less pollution and road congestion.9
Ontario Public Health Standards: Requirements for Programs, Services, and Accountability
Population Health Assessment and Surveillance Protocol, 2018
References:
1. Statistics Canada [Internet]. Ottawa (ON): Statistics Canada; [modified 2019 Feb 22]. Table 14-10-0090-01 labour force characteristics by province, territory and economic region, annual; [modified 2019 Feb 20; cited 2019 Feb 20] Available from: https://www150.statcan.gc.ca/t1/tbl1/en/cv.action?pid=1410009001
2. Ketcheson J, Kyui N, Vincent B. Labour force participation: a comparison of the United States and Canada [Internet]. Ottawa (ON): Bank of Canada; 2017 [cited 2019 Jan 20]. 13 p. Available from: https://www.bankofcanada.ca/wp-content/uploads/2017/07/san2017-9.pdf
3. Fields A, Uppal S, LaRochelle-Côté S. The impact of aging on labour market participation rates [Internet]. Ottawa (ON): Ministry of Industry; 2017 June [cited 2019 Feb 20]. 12 p. Available from: https://www150.statcan.gc.ca/n1/en/pub/75-006-x/2017001/article/14826-en... Catalogue no. 75-006-X
4. 2006 Census data products [Internet]. Ottawa (ON): Statistics Canada; [modified 2016 Jan 20]. Profile of labour market activity, industry, occupation, education, language of work, place of work and mode of transportation for Canada, provinces, territories, census divisions and census subdivisions, 2006 census; [modified 2015 Feb 9; cited 2019 Feb 4]; [about 111 p.]. Available from: https://www12.statcan.gc.ca/census-recensement/2006/dp-pd/prof/rel/Rp-en... Catalogue no. 94-579-VCB2006001
5. 2016 Census data products [Internet]. Ottawa (ON): Statistics Canada; [modified 2019 Feb 15]. Commuting Flow from Geography of Residence to Geography of Work - Census Divisions: Sex (3) for the Employed Labour Force Aged 15 Years and Over Having a Usual Place of Work, in Private Households, 2016 Census - 25% Sample Data; [modified 2015 Feb 20; cited 2019 Feb 20]; [about 439 p.]. Available from:https://www12.statcan.gc.ca/census-recensement/2016/dp-pd/dt-td/Rp-eng.c... Catalogue no. 98-400-X2016391
6. Ontario Ministry of Health and Long-Term Care. Health equity guideline [Internet]. Toronto (ON): Queen’s Printer for Ontario; 2018 [cited 2019 Feb 9]. 20 p. Available from: http://www.health.gov.on.ca/en/pro/programs/publichealth/oph_standards/d...
7. Bartley M. Unemployment and ill health: understanding the relationship. J Epidemiol Community Health [Internet]. 1994 [cited 2019 Feb 20]; 48:333-7. Available from: https://jech.bmj.com/content/jech/48/4/333.full.pdf
8. Simcoe Muskoka District Health Unit. Healthy community design: policy statements for official plans [Internet]. Barrie (ON): Simcoe Muskoka District Health Unit; c2010 [revised 2014 April; cited 2019 Feb 20]. 44 p. Available from: http://www.simcoemuskokahealth.org/docs/default-source/jfy-communities/H... ISBN: 978-1-896603-14-8
9. Statistics Canada. Journey to work: key results from the 2016 Census. Dly Stat Can [Internet]. 2017 Nov 29 [cited 2019 Feb 20]:[12 p.]. Available from: https://www150.statcan.gc.ca/n1/daily-quotidien/171129/dq171129c-eng.htm
Last modified on: March 18, 2019
Jargon Explained
London Economic Region
A geographic area used to describe a regional economic activity zone of influence which includes not only London but also the surrounding areas such as Middlesex, St. Thomas, Woodstock, Tillsonburg and much of Elgin County.
Labour Force
People over the age of 15 years who are currently employed and those who are unemployed but were available to start work in the week prior to the Census and looked for work in the past 4 weeks. It excludes anyone who may have been without a job and was not actively looking for work.


