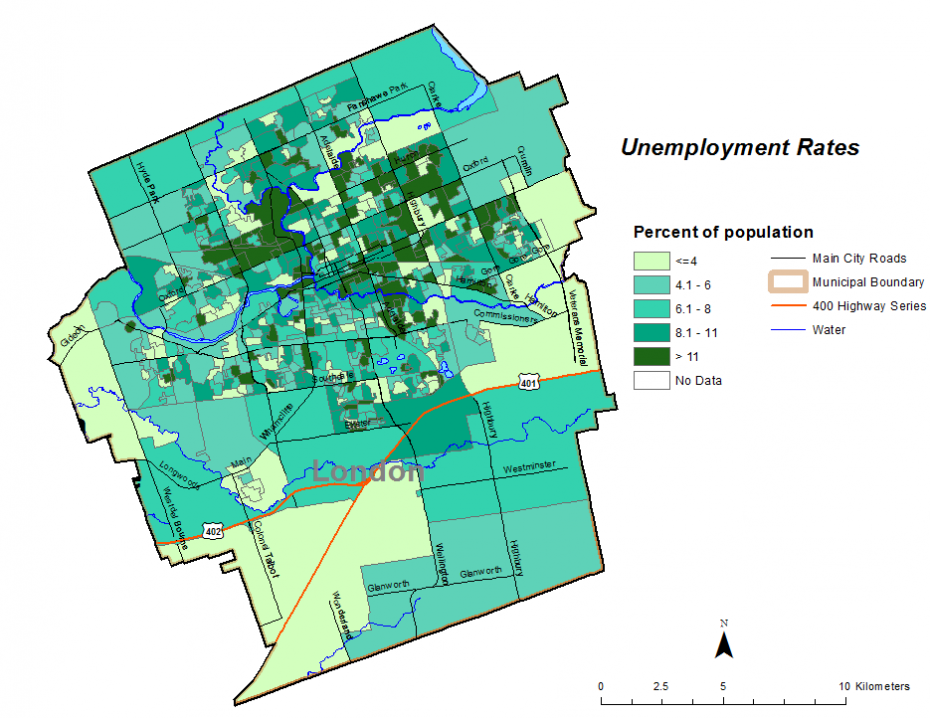
Figure 2.2.4: Unemployment rate
Percent of labour force participants (age 15+) by dissemination area, City of London, 2016

Source:
Statistics Canada, 2016 Census of Population, 25% sampleThe map indicates that levels of unemployment varied within the City of London according to the Census in 2016.