Housing
Housing
Just over one third (36.5%) of private households in Middlesex-London were rented (i.e., tenant households) while the remainder were owned (63.5%) according to the 2016 Census. There were slightly more tenant households in Middlesex-London as compared to Ontario in 2016 (30.2%).1
Homelessness was experienced by 406 individuals and families on April 24, 2018, the day of the City of London’s point in time count.2 Among those individuals:
Our Health Counts London estimated that one in five (22%) of Indigenous adults in London were precariously housed or experiencing homelessness at the time of the survey in 2016, a rate much higher than the average of Canadian adults (4%).3
Acceptable housing is described as: affordable; requires no major repairs; and, is not overcrowded. Indicators of these three dimensions are measured on the Census. A quarter of all Middlesex-London households (25.9%) in 2015, had a shelter-cost-to-income ratio of 30% or more which is considered not to be affordable.4 This was slightly lower than Ontario overall (27.7%) (Figure 2.4.1).
A much higher percent of tenant households (45.7%) than owner households (14.3%) were spending 30% or more on shelter costs in Middlesex-London in 2015. This pattern was the same in Ontario overall. The same percent of tenant households in Ontario (45.7%) did not have affordable housing and slightly more owner households in Ontario were not affordable (19.8%) compared with Middlesex-London (Figure 2.4.1).
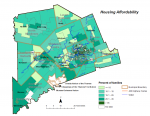
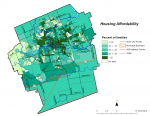
Maps of the County of Middlesex and the City of London indicate that the rate of households which were spending more than 30% of their household income on shelter costs varies across Middlesex-London from less than or equal to 10% to over 35%. (Figure 2.4.2 and Figure 2.4.3).
The percent of Middlesex-London households that reported that their dwelling was in need of major repairs was 5.8% in Middlesex-London in 2015. This was similar to Ontario overall (6.1%).1 Our Health Counts London estimated that 21% of Indigenous adults in London lived in a dwelling that was in need of major repairs.3
The percent of Middlesex-London households that were deemed to be not suitable because they did not have enough bedrooms for the size and composition of the household was 4.1%, slightly lower than for Ontario overall; which was 6.0% in 2015. 1 Our Health Counts London estimated that 9% of Indigenous adults lived in crowded dwellings.3
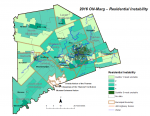
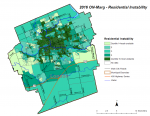
Maps of the County of Middlesex and the City of London indicate that residential instability varies across Middlesex-London. (Figure 2.4.4 and Figure 2.4.5).
Housing, is considered a key determinant of health.5 The lack of access to acceptable housing is linked to increased physical and mental health problems and may also make it more difficult to fund other necessities such as food, clothing and transportation.6 Acceptable housing can be considered affordable, requires no major repairs, and is not overcrowded. These three dimensions are measured on the Canadian Census.
Housing affordability is assessed according to the Canada Mortgage and Housing Corporation and is based on whether the household spent 30% or more of its average monthly total income on shelter costs.4 Included in shelter costs are: mortgage payments or rent, the cost of electricity, heat, water and other municipal services, property taxes and condominium fees.
Unsuitable housing is defined as not having enough bedrooms for the size and composition of the household according to the National Occupancy Standard.4 The standard identifies that: there should be no more than two persons per bedroom, children less than 18 years of age and of the same sex may reasonably share a bedroom, children five years of age or older should have separate bedrooms.
Residential instability is an area based summary measure. It is one of the components of the Ontario Marginalization Index and identifies neighbourhood concentrations of people who experience high rates of family or housing instability. It is related to neighborhood quality, cohesiveness and supports.7
There is an undercounting of Indigenous people particularly those with Registered or Treaty Indian status in housing indicators on the Census. First Nations adjacent to Middlesex-London did not participate in the long-form census - likely because of a distrust of government due to past and present colonial policies 8. For example, the Census does not indicate how many households are band housing in the Middlesex-London area. Also, First Nations are not included in shelter-cost data. Our Health Counts London provides information on the housing situation for urban Indigenous populations in London.3
Ontario Public Health Standards: Requirements for Programs, Services, and Accountability
Population Health Assessment and Surveillance Protocol, 2018
References:
1. Census Profile, 2016 Census [Internet]. Ottawa (ON): Statistics Canada; 2017 Feb [updated 2018 May 30; cited 2019 Feb 19]. Available from: http://www12.statcan.gc.ca/census-recensement/2016/dp-pd/prof/index.cfm?Lang=E Catalogue no. 98-316-X2016001
2. City of London. Counting our way home: London’s 2018 community enumeration event results [Internet]. London (ON): City of London; 2018 Sept [cited 2019 Feb 20]. 2 p. Available from: http://www.london.ca/residents/homeless-prevention/Documents/171030028-COL-Enumeration-Event-2018-Summary-Report-EMAIL-WEB.pdf
3. Firestone M, O’Brien K, Xavier C, Dokis B, Maddox R, Muise GM, Maddox R, Smylie J. Our health counts London [Internet]. London (ON): Southwest Ontario Aboriginal Health Access Centre; 2018. Housing and Mobility; [cited 2019 Feb 20]; [2 p.]. Available from: http://soahac.on.ca/wp-content/uploads/2018/09/OHC-03-Housing-and-Mobility-2.pdf
4. Statistics Canada. Release and concepts overview: 2016 census of population: housing [Internet]. Ottawa (ON): Statistics Canada; 2017 Aug 31 [cited 2018 Feb 19]. 26 p. Available from: https://www12.statcan.gc.ca/census-recensement/2016/ref/98-501/98-501-x2016007-eng.cfm ISBN: 978-0-660-07180-0 Catalogue no. 98-501-X2016007
5. Ontario Ministry of Health and Long-Term Care. Health equity guideline [Internet]. Toronto (ON): Queen’s Printer for Ontario; 2018 [cited 2019 Feb 9]. 20 p. Available from: http://www.health.gov.on.ca/en/pro/programs/publichealth/oph_standards/docs...
6. Butler-Jones D. The Chief Public Health Officer's report on the state of public health in Canada, 2008: addressing health inequalities [Internet]. Ottawa (ON): Her Majesty the Queen in Right of Canada, represented by the Minister of Health; 2008 [cited 2019 Feb 20]. 122 p. Available from: https://www.canada.ca/en/public-health/corporate/publications/chief-public-health-officer-reports-state-public-health-canada/report-on-state-public-health-canada-2008.html
7. Matheson, FI; Ontario Agency for Health Protection and Promotion (Public Health Ontario). 2016 Ontario marginalization index: user guide. Toronto, ON: Providence St. Joseph’s and St. Michael’s Healthcare; 2018. Joint publication with Public Health Ontario. [cited 2019 Feb 20] Available from: https://www.publichealthontario.ca/en/eRepository/userguide-on-marg.pdf
8. Ontario Ministry of Health and Long-Term Care, Population and Public Health Division. Relationships with Indigenous communities guideline, 2018 [Internet].Toronto (ON): Queen’s Printer for Ontario; 2018 [cited 2019 Feb 20]. 26 p. Available from: http://health.gov.on.ca/en/pro/programs/publichealth/oph_standards/docs/protocols...
Last modified on: March 18, 2019
Jargon Explained
Affordable housing
Is measured using the shelter-cost-to-income ratio. When households spend 30% or more of their total before-tax household income on shelter costs it is considered not to be affordable.
Unsuitable housing
Is defined as not having enough bedrooms for the size and composition of the household according to the National Occupancy Standard.
Residential Instability
This measure refers to area-level concentrations of people who experience high rates of family or housing instability. The indicators included in this dimension measure the types and density of residential accommodations, as well as certain family structure characteristics such as proportion of the population who are single/ divorced/ widowed. It is one of the components of the Ontario Marginalization Index.


