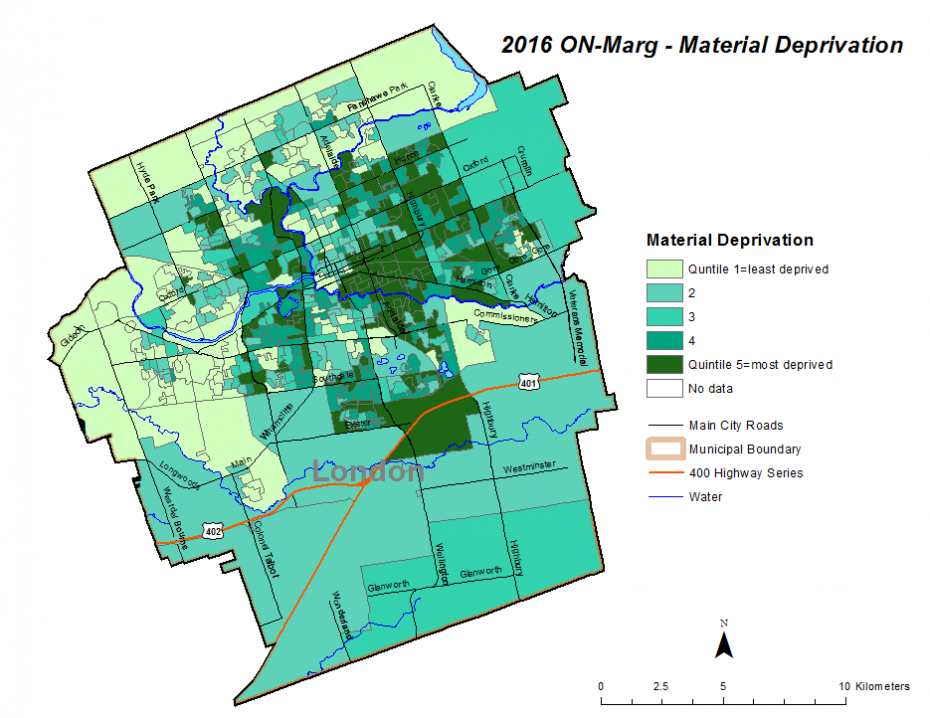
Figure 2.3.10: Material deprivation quintiles by dissemination area
Percent of area population, City of London, 2016

Source:
Statistics Canada, 2016 Census of Population, 25% sampleNote:
Material deprivation quintiles are grouped based on Ontario cut-offs. With this method, quintiles are weighted provincially, so that each quintile contains 20% of all Ontario dissemination areas. This means that the distribution of quintiles across Middlesex-London or the City of London will not necessarily be equal, however it is helpful for making comparisons between geographies using provincially comparable measures of marginalization.
The map of material deprivation indicates areas of concentration within the City of London.