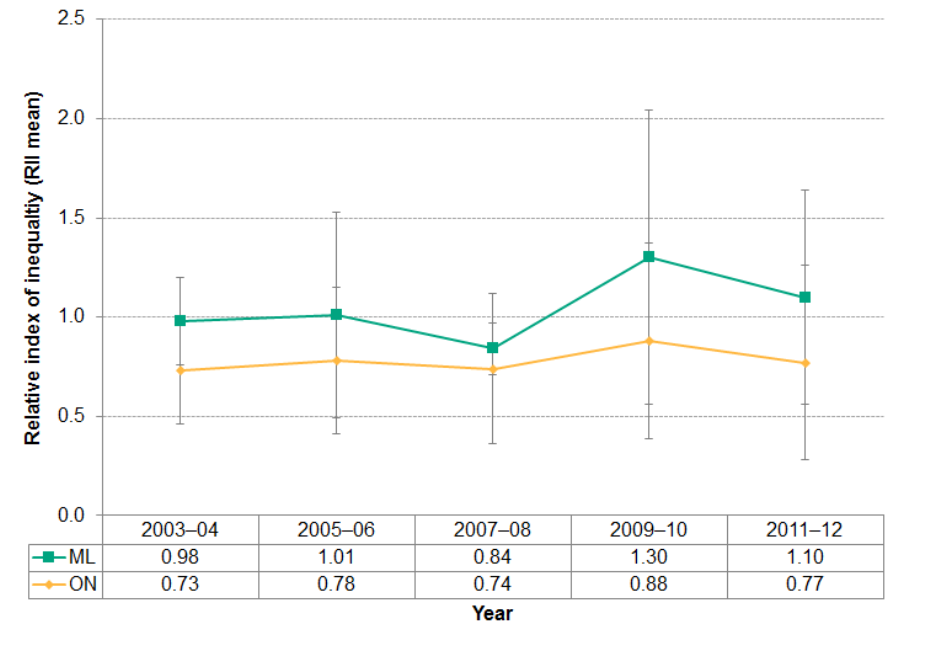
Figure 2.6.10: Socio-economic inequalities in potentially avoidable deaths
Relative index of inequality (mean) (age 0–75), Middlesex-London and Ontario, 2003–04 to 2011–12 annual average

Source:
Public Health Ontario. Snapshots: Middlesex-London Health Unit: Health Inequities in Potentially Avoidable Mortality 2009. Toronto, ON: Ontario Agency for Health Protection and Promotion; 2018 May 9 [2019 Mar 15]. Available from: http://www.publichealthontario.ca/en/DataAndAnalytics/Snapshots/Pages/Potentially-Avoidable-Mortality-Inequities.aspx Ontario Mortality Data, 2003-2012, Ontario Ministry of Health and Long-Term Care, IntelliHEALTH ONTARIO, Date extracted: 2017 Aug 31Note:
Socioeconomic status was assigned to an individual based on the neighbourhood proxy measure of the Ontario Marginalization - material deprivation quintiles using Ontario cut-offs for comparison purposes. 2007-2008 health status data are assigned to 2006 ON-Marg quintiles, and 2009-2012 health status data are assigned to 2011 ON-Marg quintiles.
Relative differences are slightly higher but not significantly different than those experienced across Ontario as a whole based on the relative index of inequality.
The relative index of inequality was lowest in 2007–08 and has increased since that time, but differences in potentially avoidable mortality have not changed significantly since 2003–04.