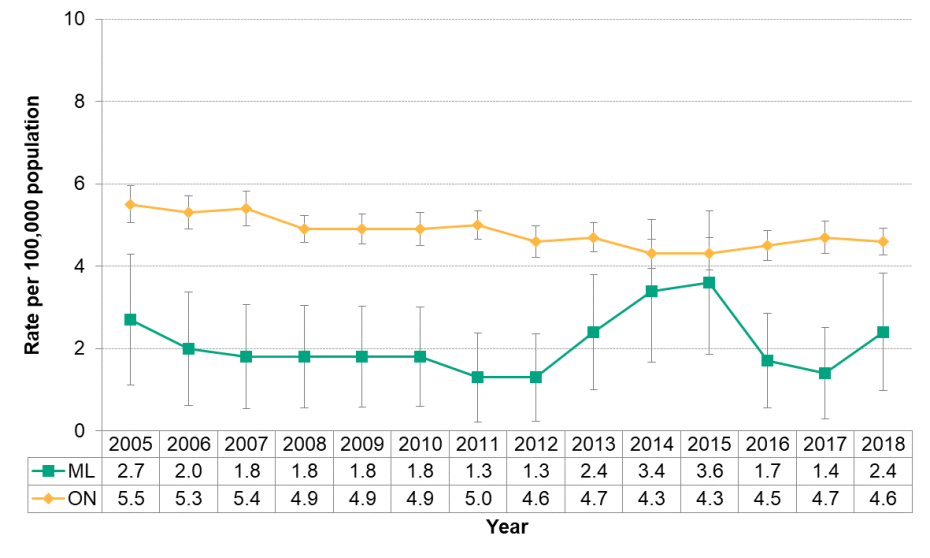
Figure 9.2.6: Active tuberculosis by year
Rate of active tuberculosis infections reported per 100,000 population, Middlesex-London and Ontario, 2005 to 2018

Source:
Public Health Ontario Infectious Diseases Query: Middlesex-London Health Unit: Case counts and crude rates of reportable diseases by year. Toronto ON: Ontario Agency for Health Protection and Promotion; 2019 May 1 [cited 2019 May 7].Between 2005 and 2018, the rate of active tuberculosis cases in Middlesex-London fluctuated while the Ontario rate generally declined.
Across the 14-year timeframe, the rate of active tuberculosis infections reported among Middlesex-London residents was consistently lower than the rate in Ontario; the difference was significant in all but two years.