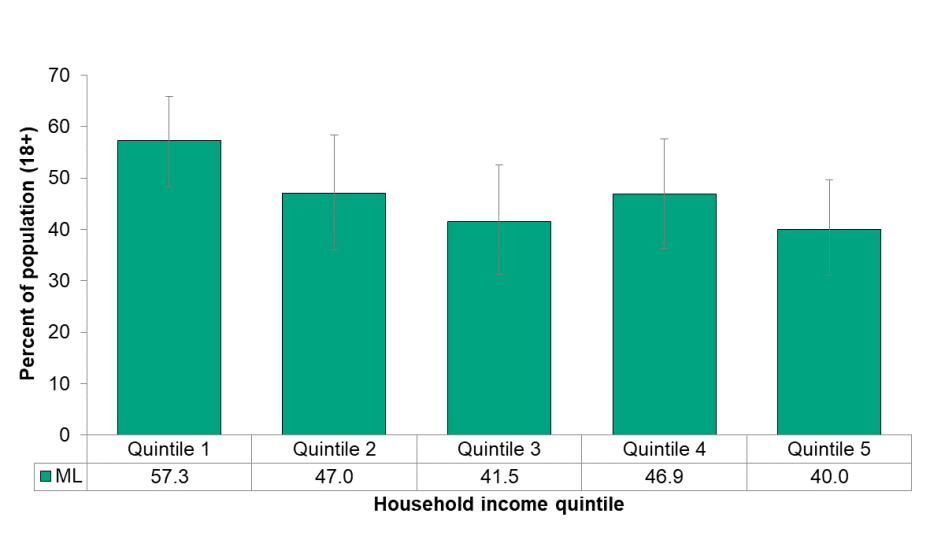
Figure 6.2.6: Used active transportation by household income
Percent of the population (18+) who reported using active transportation in the past week, Middlesex-London, 2015/16

Source:
Canadian Community Health Survey [2015-2016], Statistics Canada, Share File, Ontario Ministry of Health and Long-Term CareGenerally, there was a decrease in the use of active transportation as income quintile increased in Middlesex-London.
Although not statistically significant, Q1 (the lowest income group) had a higher rate of use of active transportation (57.3%) compared to the highest income group (40.0%).