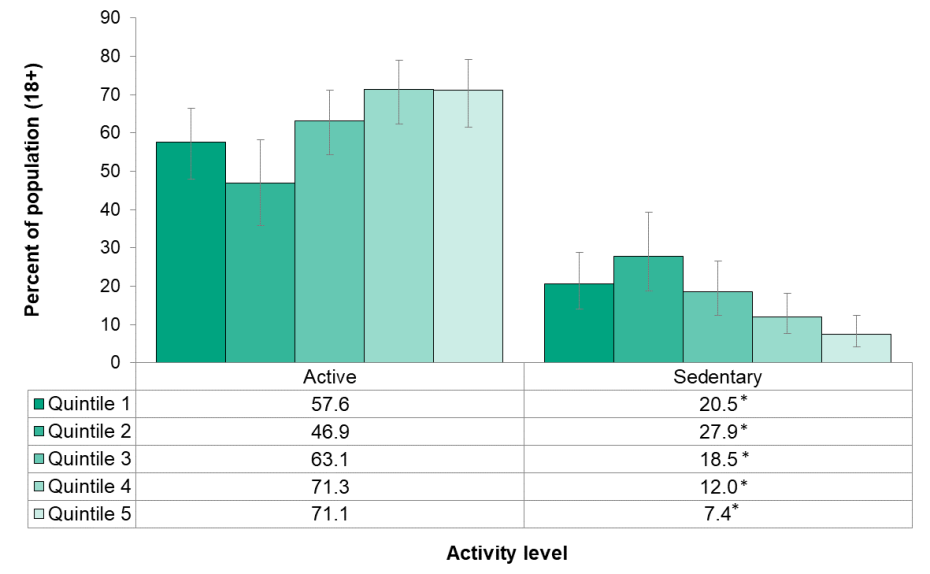
Figure 6.2.3: Met physical activity guidelines by income quintile
Percent of the population (18+) who were active according to the Canadian Physical Activity Guidelines, Middlesex-London, 2015/16

Source:
Canadian Community Health Survey [2015-2016], Statistics Canada, Share File, Ontario Ministry of Health and Long-Term CareNote:
*Estimate should be interpreted with caution due to high variability
Generally, as income level increased, the proportion of people who were active also increased. The one exception was that the lowest income quintile was more active than the second lowest quintile.
The percent of people who were active in the highest income group (Q5) (71.3%) was significantly higher than the percent of people who were active in the second lowest quintile (Q2) (46.9%).
A general decrease in the percent of people who were reported as having sedentary behaviour was seen as income increased.