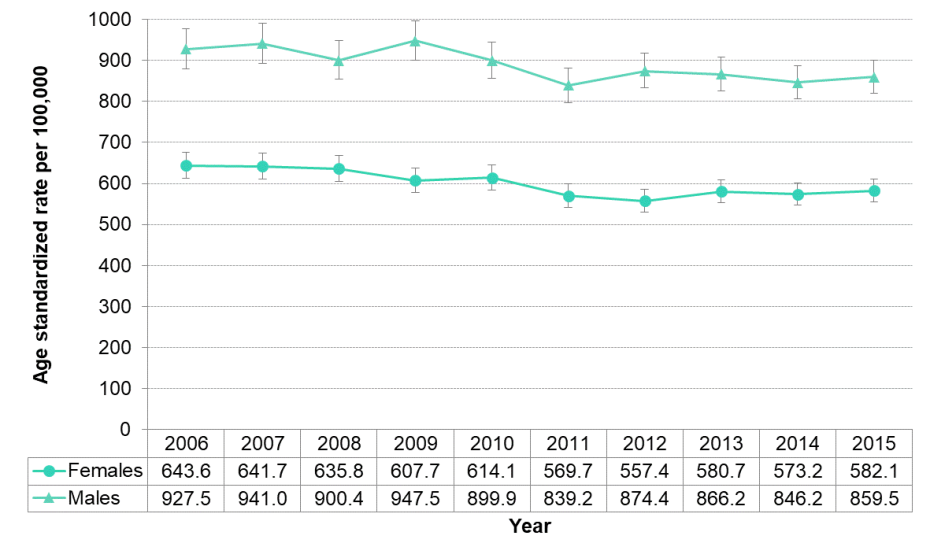
Figure 3.3.4. All-cause mortality by sex
Age-standardized rates per 100,000 population, Middlesex-London, 2006 to 2015

Source:
Ontario Mortality Data, Ontario Ministry of Health and Long-Term Care, IntelliHEALTH ONTARIO, Date Extracted: April 26, 2019; Population Estimates, Ontario Ministry of Health and Long-Term Care, IntelliHEALTH Ontario, Date Extracted: May 26, 2018Females consistently had a significantly lower all-cause age-standardized mortality rate than males in Middlesex-London over the decade spanning 2006 to 2015 and the decrease from in the rate for females from 643.6/100,000 in 2006 to 582.1/ 100,000 in 2015 was also a significant decline over time. There was less overall decrease in the male rate over-time.
When the sex-specific age-standardized rates for Middlesex-London were considered more closely, there was an interesting pattern whereby an increase in the male all-cause mortality rate in 2009 and again in 2012, precedes an increase in the female rate a year later.