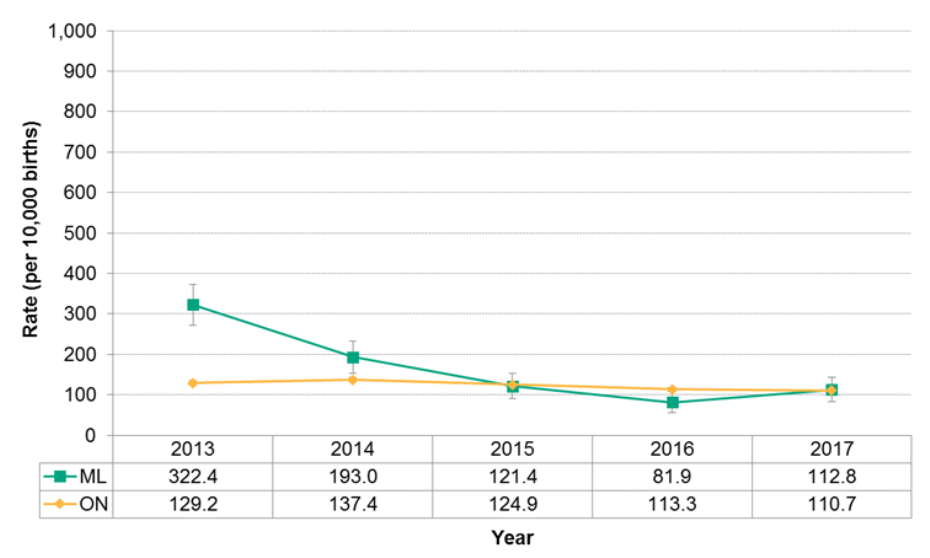
Figure 12.1.15: Births with confirmed congenital anomalies
Rate per 10,000 births (live or still), Middlesex-London and Ontario, 2013 to 2017

Source:
BORN PHU - Newborn, BORN Information System, BORN Ontario. Information accessed on October 22, 2018.The rate of births (live or still) Middlesex-London with one or more confirmed congenital anomalies was 112.8 per 10,000 in 2017, compared to 110.7 in Ontario; a difference that is not statistically significant. Between 2013 and 2017, the rate in Middlesex-London decreased over time from 322.4 to 112.8 per 10,000 births (Fig. 12.1.15).