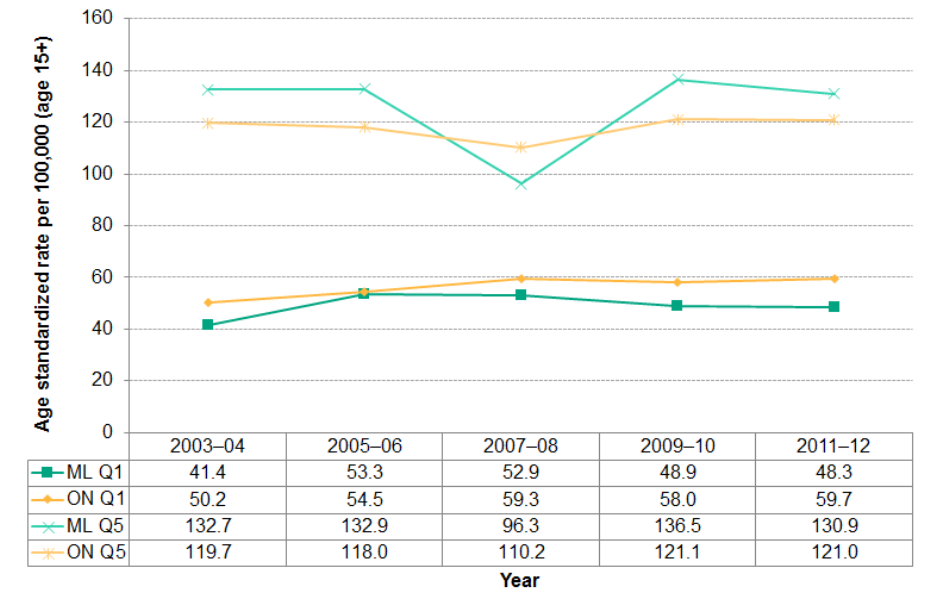
Figure 2.6.6: Alcohol attributable hospitalization rate for material deprivation quintiles Q1 and Q5
Age standardized hospitalization rate per 100,000 population (age 15+), Middlesex-London and Ontario, 2003–04 to 2011–12 annual average

Source:
Snapshots: Middlesex-London Health Unit: Health Inequities in Alcohol-Attributable Hospitalizations 2011-12. Toronto, ON: Ontario Agency for Health Protection and Promotion; 2018 May 9 [2019 Mar 14]. Available from: http://publichealthontario.ca/en/DataAndAnalytics/Snapshots/Pages/Alcoho...
Distract Abstract Database (DAD), 2003-2012, Ontario Ministry of Health and Long-Term Care, IntelliHEALTH ONTARIO, Date extracted: 2018 February 14. Ontario Mental Health Reporting System (OMHRS), 2003-2012, Ontario Ministry of Health and Long-Term Care, IntelliHEALTH ONTARIO, Date extracted: 2018 February 14
Generally, the inequalities between Q1 and Q5 persisted for both Middlesex-London and Ontario for all years however there were no significant difference between Middlesex-London and Ontario based on the absolute rate differences. During the time period reviewed, there were overall increases in alcohol attributable hospitalizations.