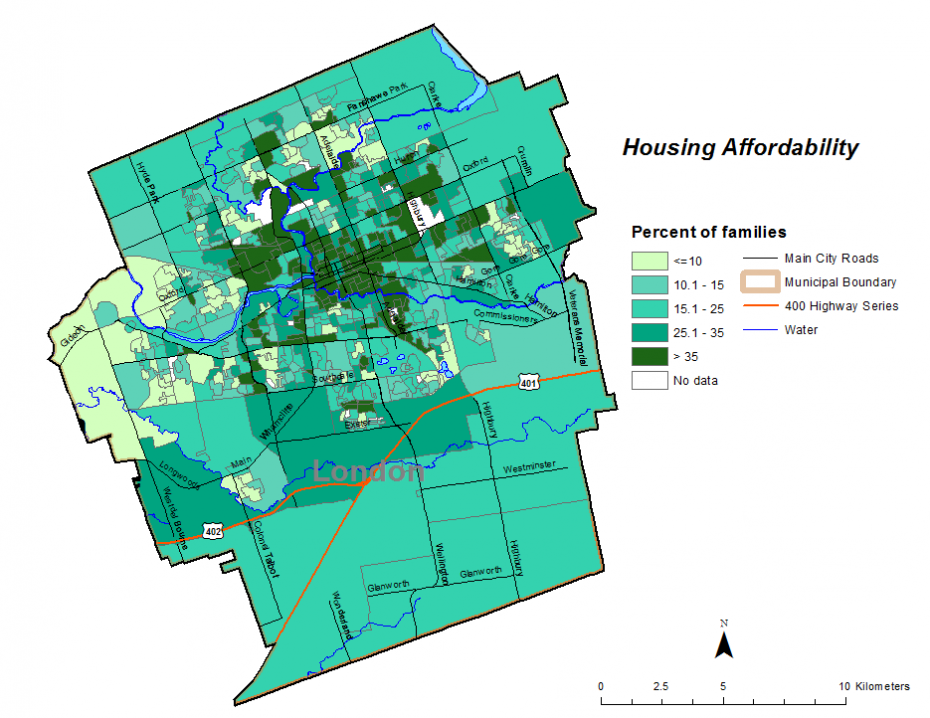
Figure 2.4.3: Housing affordability
Percent of households spending 30% or more of income on shelter costs by dissemination area, City of London, 2015

Source:
Statistics Canada, 2016 Census of Population, 25% sampleNote:
Includes owner and tenant households with household total income greater than zero; in non-farm; non- First Nation community private dwellings
The maps of the City of London indicates that the rate of households which were spending more than 30% of their household income on shelter costs varies across the City of London.