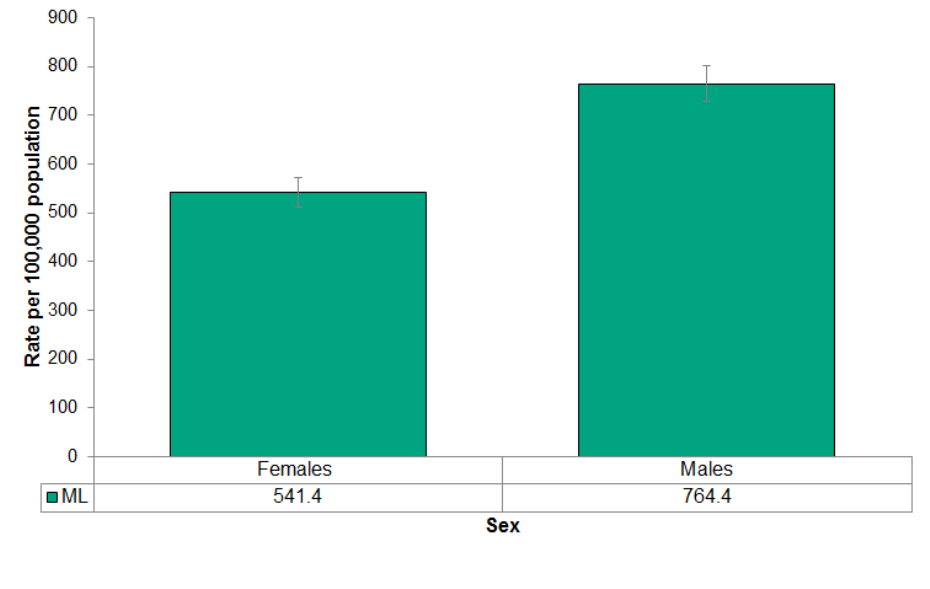
Figure 4.4.7: Motor vehicle collisions causing personal injury or death by sex
Rates per 100,000 population, Middlesex-London and Ontario, 2013 to 2015 annual average

Source:
Ministry of Transportation Collision Database, Released: Feb 1, 2019; Population Estimates, Ontario Ministry of Health and Long-Term Care, IntelliHEALTH Ontario, Date Extracted: May 22, 2018Males (764.4 per 100,000) were significantly more likely to be the driver in a motor vehicle collision causing personal injury or death than females (541.4) for the time period averaged between 2013 and 2015.