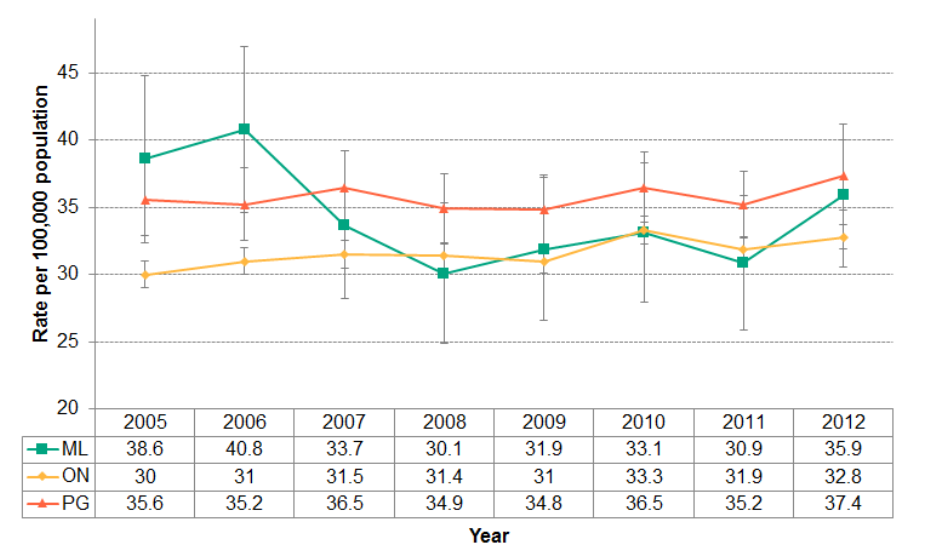
Figure 4.1.1: Deaths from unintentional injury
Age-standardized rates per 100,000 population, Middlesex-London, Peer Group and Ontario, 2005 to 2012

Source:
Ontario Agency for Health Protection and Promotion (Public Health Ontario). Snapshots: Mortality from all unintentional injuries – age standardized rate (both sexes) 2005-2012 [Internet]. Toronto, ON: Queens’s Printer for Ontario; [updated 2017 Jun 30; cited 2018 Oct 31]. Available from: http://www.publichealthontario.ca/en/DataAndAnalytics/Snapshots/Pages/Injury-Mortality.aspxAge-standardized death rates related to all unintentional injuries in Middlesex-London did not change significantly between 2005 and 2012. There has also been a stable trend in Ontario and the Peer Group over the same timeframe.
The rates in Middlesex-London, Ontario and the Peer Group were not significantly different from each other.