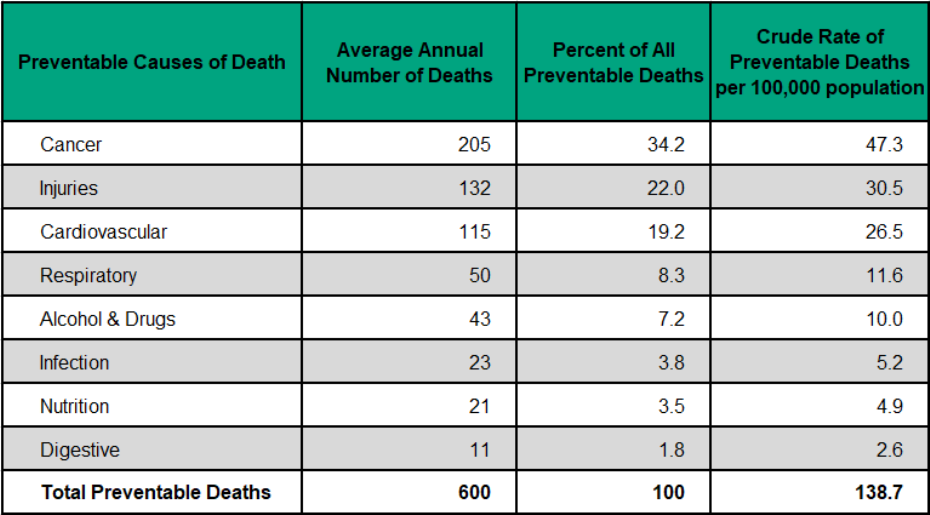
Figure 3.5.4: Preventable causes of death, count, percent and rate
Middlesex-London, 2013 to 2015 annual average

Source:
Ontario Mortality Data, Ontario Ministry of Health and Long-Term Care, IntelliHEALTH ONTARIO, Date Extracted: April 26, 2019; Population Estimates, Ontario Ministry of Health and Long-Term Care, IntelliHEALTH Ontario, Date Extracted: May 26, 2018Note:
Injuries include all injuries including adverse, intentional, unintentional and undetermined
Cancer, injuries and cardiovascular diseases contributed to over three quarters of preventable deaths in residents of Middlesex-London from 2013 to 2015.