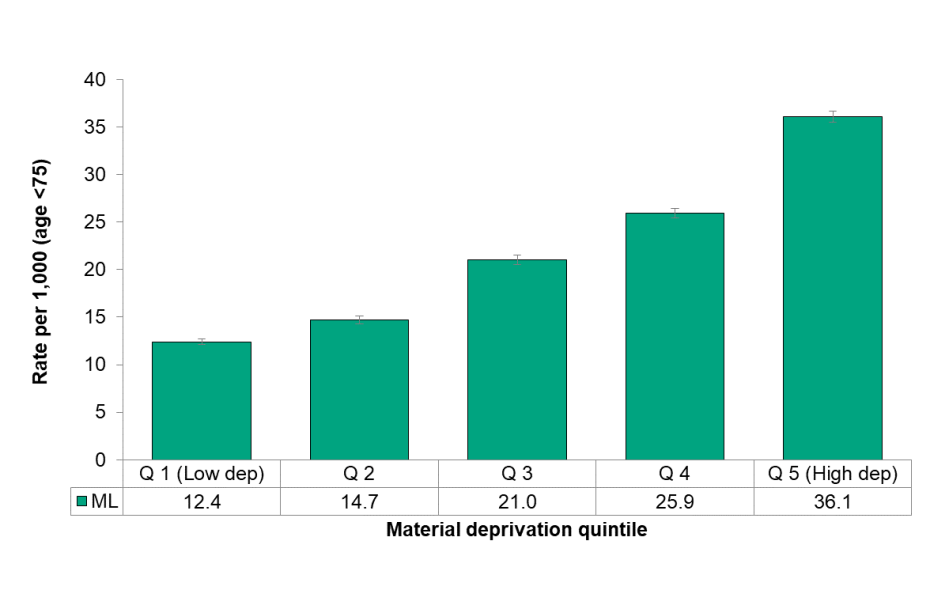
Figure 3.6.8: Preventable potential years of life lost by material deprivation quintile, age standardized rate per 1,000 population , age <75
Middlesex-London, 2011–2015 annual average

Source: Ontario Mortality Data, Ontario Ministry of Health and Long-Term Care, IntelliHEALTH ONTARIO, Date Extracted: April 26, 2019; 2016 census of population – dissemination area: Census profile - age and sex for Canada, provinces, territories, census divisions, census subdivisions and dissemination areas, 2016 census [Internet]. Ottawa, ON: Statistics Canada; 2017 Nov 29, Date Extracted Dec 12, 2018 ,2016 Ontario marginalization index. Toronto, ON: Providence St. Joseph’s and St. Michael’s Healthcare; 2018. Joint publication with Public Health Ontario.
The age standardized rate of PYLL significantly increased with each material deprivation quintile on average from 2011 to 2015 in Middlesex-London. The rate for those that lived in the most well-off neighbourhoods was almost a third (Q1; 12.4/1,000 population) that of the most material deprived neighbourhoods (Q5: 36.1/1,000 population). This is a rate difference of 23.7 PYLL per 1,000 population.