Age and Sex Distribution
Age and Sex Distribution
The population pyramid shows peaks and valleys in the age structure for Middlesex-London in 2016. The first peak in 50 to 54 year olds coincides with the end of the baby boom generation (1946-1965) caused by high fertility rates following World War II. The second peak in 20-24 year olds may correspond to the end of the baby boom echo or children of the baby boomers (1972-1992). It may also reflect the draw of young adults to the urban population centre of London and its associated educational and employment opportunities (Figure 1.3.1).
A generational shift is happening in Middlesex-London as it is across Canada.1 In 2016 the census population included more seniors (76,740 aged 65 and older) than children (74,835 aged 14 and younger). This is compared to 2011, where there were fewer seniors (65,190) compared with children (72,795), despite the overall increase in the population.
The age structure for Middlesex-London is generally similar to Ontario’s age structure. However, the percent of young adults (aged 20 to 29) in Middlesex-London (14.5%) was slightly higher than in Ontario (13.2%) and the percent of middle-aged adults (aged 40-54) in Middlesex-London (20.1%) was slightly lower than in Ontario (21.3%) (Figure 1.3.1).
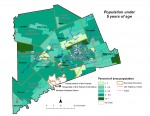
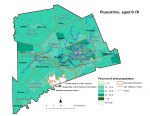
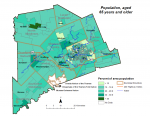
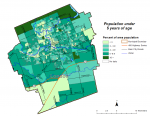
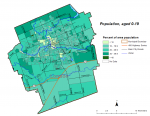
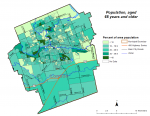
Maps (Figures 1.3.2, 1.3.3, 1.3.4, 1.3.5, 1.3.6 and 1.3.7) show the wide distribution of people in more dependent age groups (0 to four, 0 to 19, 65 and older) across the City of London and the County of Middlesex, according to 2016 Census data. Of note is the low percent of children and youth in the City of London’s downtown core.
The total dependency ratio was 65 in 2016 indicating there were 65 youth (aged 19 and younger) or seniors (aged 65 +) combined for every 100 people in the working age population (aged 20 to 64) (Figure 1.3.8) in Middlesex-London. The youth dependency ratio (37) was higher than the senior dependency ratio (28) indicating that there were still more dependent children and youth overall than seniors (Figure 1.3.8). However, the Middlesex-London senior dependency ratio was much higher in 2016 (28) than in 2006 (22).
Overall, all dependency ratios for Middlesex-London were the same as those for Ontario (Figure 1.3.8).
Interpretive Notes
The distribution of the population by age groups is important for understanding the delivery of public health services now and into the future. Dependency ratios measure the relative proportion of people who are considered dependent in a population, those who are age 19 and under or age 65 or older, relative to those aged 20 to 64. The higher the dependency ratio, the greater the number of people who may be dependent on others such as family, caregivers or government support.2 A rising senior dependency ratio may be a concern in countries that are facing an aging population, since it may become more difficult for pension, social security systems and health services to provide for an older non-working population.3 A dependency ratio of 65 means that there are 65 children, youth or seniors for every 100 people between the ages of 20 and 64 years. The dependency ratio assumes that all people 20 to 64 years of age are not dependant and that all people over the age of 65 are dependent, an assumption that does not hold true for all.
The 2016 Census of the Population, undertaken every five years across Canada, provides one of the best statistical profiles of Middlesex-London. However, it should be interpreted with caution as it is known to underrepresent Indigenous populations. In 2016, the Chippewas of the Thames First Nation and the Oneida Nation of the Thames band councils did not give Statistics Canada permission to enter their territory and did not participate in the Census. In addition, less than 50 percent of the members of Munsee-Delaware Nation completed the more detailed questions such as age group. For these reasons, which are likely rooted in a distrust of government due to past and present colonial policies, there is an undercounting of Indigenous people and in particular an undercounting of those with Registered or Treaty Indian status. Our Health Counts London, a recent urban Indigenous study led by the Southwest Ontario Aboriginal Health Access Centre, indicated that only 14% of Indigenous adults that live, work or use services in London completed the 2011 Census.4
Ontario Public Health Standards: Requirements for Programs, Services, and Accountability
Population Health Assessment and Surveillance Protocol, 2018
References:
- Statistics Canada. The Daily - Age and Sex, and type of dwelling data: Key results from the 2016 Census [Internet]. Ottawa, ON: Statistics Canada. 2017 [updated 2017 May 3; cited 2018 Dec 3] Available from:https://www150.statcan.gc.ca/n1/daily-quotidien/170503/dq170503a-eng.htm
- Williams C. The sandwich generation. Canadian Social Trends [Internet] 2005 Summer [cited 2018 Nov 30]. Available from: htts://www150.statcan.gc.ca/n1/pub/11-008-x/2005001/article/7033-eng.pdf
- Statistics Canada. Health indicators, data and definitions, community and health system characteristics 82-221-X [Internet]. Ottawa, ON: Statistics Canada. 2000 [updated 2018 Aug 22 May 24; cited 2018 Nov 27] Available from: https://www150.statcan.gc.ca/n1/pub/82-221-x/2017003/chsc-ccss-eng.htm#chsc1_4
- Firestone M, Xavier C, O’Brien K, Maddox R, Muise GM, Dokis B, Smylie J. Our health counts London [Internet]. London, ON: Southwest Ontario Aboriginal Health Access Centre; 2018. Adult demographics; [cited 2018 Nov 27]; [3 p.]. Available from: http://soahac.on.ca/wp-content/uploads/2018/09/OHC-02A-Adult-Demographics-2.pdf
Last modified on: January 25, 2019
Jargon Explained
Dependency Ratio
The ratio of the combined child population aged 0 to 19 and population aged 65 and over to the population 20 to 64 years old.
The population aged 65 and over and those under age 20 are more likely to be socially and/or economically dependent on the working aged population, and they may also put additional demands on health services. This ratio is presented as the number of dependents for every 100 people in the working age population.
Youth Dependency Ratio
Number of children under the age of 20 divided by the number of people aged 20 to 64 multiplied by 100.
Seniors Dependency Ratio
Number of people aged 65 years and older divided by the number of people aged 20 to 64 multiplied by 100. (Also known as Elderly Dependency Ratio.)

