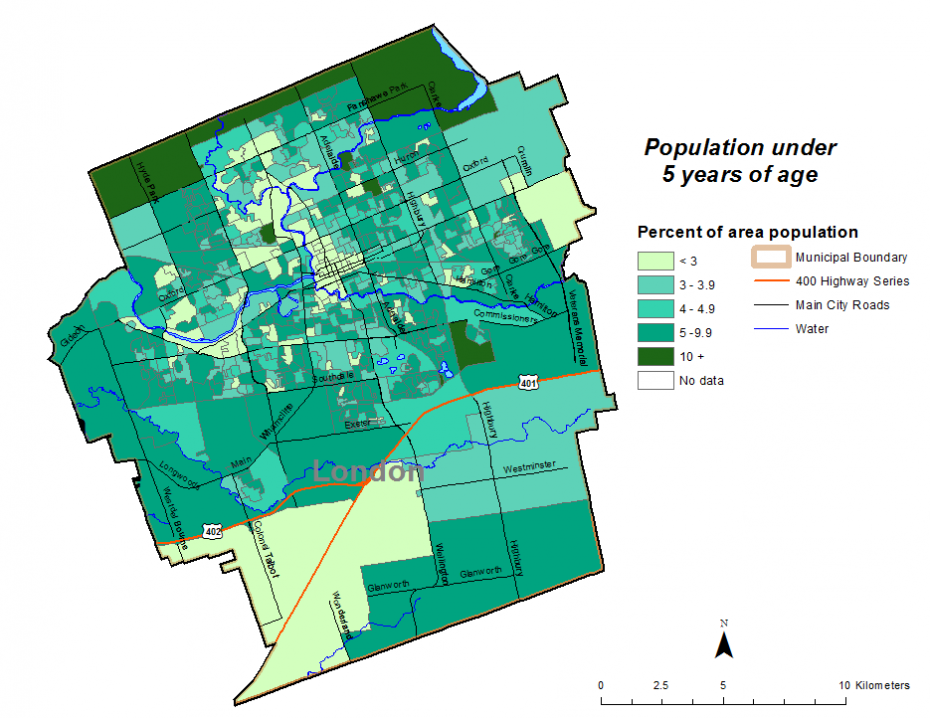
Figure 1.3.5 Population (age 0-4) by dissemination area
Percent of area population, City of London, 2016

Source:
Statistics Canada, 2016 Census of Population (Unadjusted)The map shows how the distribution of children aged zero to four varied in the City of London, according to 2016 Census data.