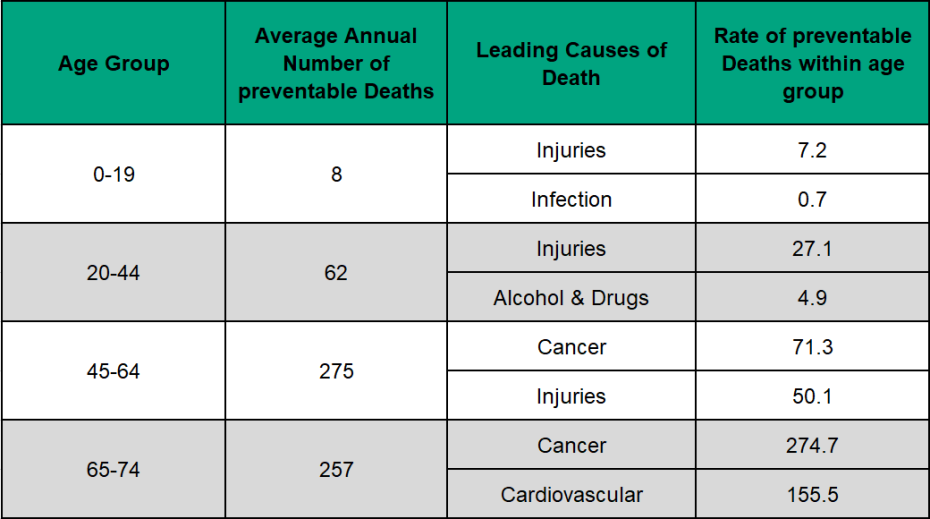
Figure 3.5.6: Preventable mortality by cause group (top 2), (age <75), rate per 100,000 age group population
Middlesex-London, 2013-15 annual average

Source:
Ontario Mortality Data, Ontario Ministry of Health and Long-Term Care, IntelliHEALTH ONTARIO, Date Extracted: April 26, 2019; Population Estimates, Ontario Ministry of Health and Long-Term Care, IntelliHEALTH Ontario, Date Extracted: May 26, 2018Note:
Injuries include all injuries including adverse, intentional, unintentional and undetermined
Injuries were by far the most preventable cause of death for those aged 0-19, followed by infection from 2013 to 2015. For those aged 20-44, injury was also by far the most frequently reported preventable cause of death followed by alcohol and drugs. In those aged 45-64, injury slipped to second place behind cancer and in those 65-74, cancer and cardiovascular disease were the most frequently reported preventable cause of death.