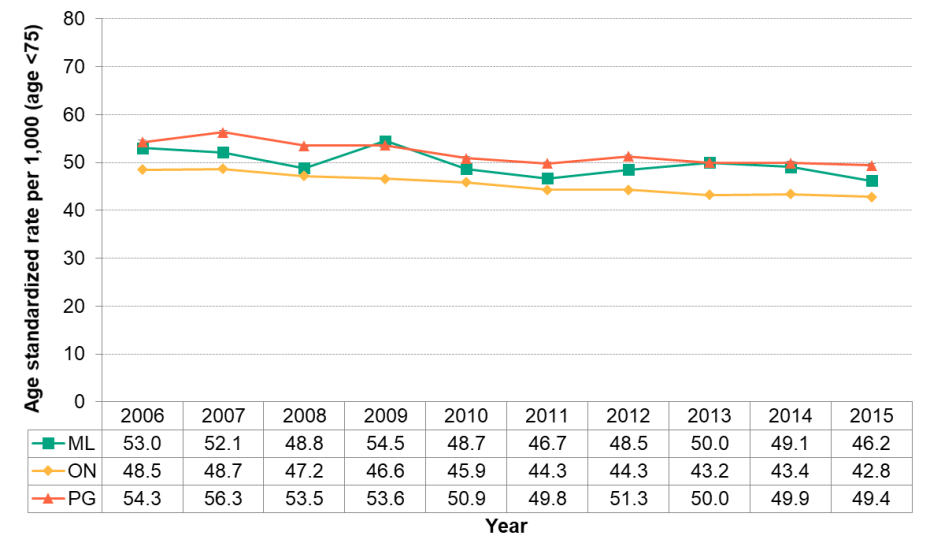
Figure 3.6.1: Potential years of life lost, age standardized rate per 1,000 population, age <75
Middlesex-London, Ontario, Peer Group, 2006 to 2015

Source:
Ontario Mortality Data, Ontario Ministry of Health and Long-Term Care, IntelliHEALTH ONTARIO, Date Extracted: April 26, 2019; Population Estimates, Ontario Ministry of Health and Long-Term Care, IntelliHEALTH Ontario, Date Extracted: May 26, 2018There has been a general decrease in the rate of potential years of life lost (PYLL) from 2006 (53.0/ 1,000 population) to 2015 (46.2/ 1,000) in Middlesex-London after population growth and age structure are taken into consideration.
There was a significant increase and peak in the rate of PYLL for one year in 2009 in Middlesex-London which corresponded with the beginning of the economic recession.
The rate of PYLL in Middlesex-London was slightly higher, but significantly different, than the rate in Ontario for each year from 2006 and 2015.