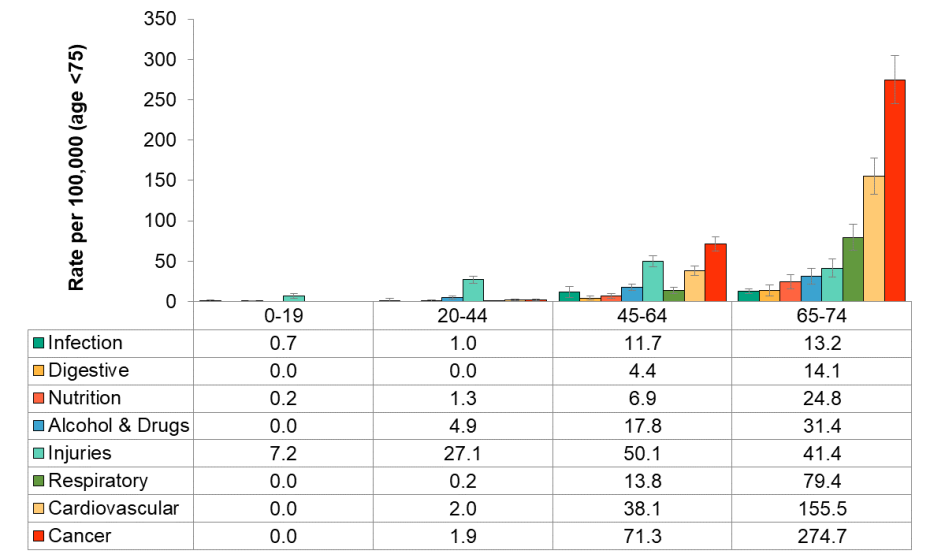
Figure 3.5.5: Preventable mortality cause group by age group (age <75), rate per 100,000 population
Middlesex-London, 2013-15 annual average

Source:
Ontario Mortality Data, Ontario Ministry of Health and Long-Term Care, IntelliHEALTH ONTARIO, Date Extracted: April 26, 2019; Population Estimates, Ontario Ministry of Health and Long-Term Care, IntelliHEALTH Ontario, Date Extracted: May 26, 2018Note:
Injuries include all injuries including adverse, intentional, unintentional and undetermined
The specific preventable causes of death varied widely by age group in Middlesex-London from 2013 to 2015.