Income-related health inequities
Income-related health inequities
A key goal of public health is to reduce health inequities in Ontario in a way that everyone has equal opportunities for optimal health and can attain their full potential.1,2 If health differences are unjust, avoidable, and systematic and can be decreased by social action, they are considered inequities.3
The four health outcomes examined in this section are areas of public health importance where public health practice is expected to have an impact and therefore any differences can be considered health inequities. Income-related measures of inequality for these four health outcomes are easily accessible on the local health unit level4 and represent a range of health outcomes where there is previous evidence of association with socio-economic status.5,6
Middlesex-London had significant socio-economic differences in the four health outcome indicators in 2011–12. Identified by size of inequality they were:
• mental health emergency department visits
(Relative Index of Inequality (RII (mean)) = 1.73)
• alcohol attributable hospitalization (RII (mean) = 1.56)
• potentially avoidable mortality (RII (mean) = 1.1)
• low birth weight births (RII (mean) = 0.87)
| Mental Health Emergency Department Visits | Potentially Avoidable Mortality |
| Alcohol Attributable Hospitalization | Low Birth Weight |
Mental Health Emergency Department Visits
Significant differences in mental health emergency department visits existed between residents living in neighbourhoods with differing levels of socio-economic status in Middlesex-London. Residents living in well-off neighbourhoods in Middlesex-London with the least material deprivation (i.e., quintile one, (Q1)) had a significantly lower rate of mental health emergency department visits per 100,000 population aged 15 and over (910.9) compared to those living in neighbourhoods with the most material deprivation (3,226.1). This is an absolute rate difference of 2,315.2 per 100,000, averaged for the two-year period 2011 to 2012 (Figure 2.6.1).
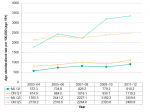
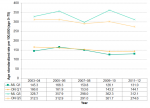
Figure 2.6.2 shows the mental health emergency department visit rate for residents in low socioeconomic status versus high socioeconomic status neighbourhoods in Middlesex-London compared to Ontario over time. The rates in Middlesex-London for those in the highest socioeconomic group (Q1) are consistently lower than Ontario over time. However, the rates in Middlesex-London for those in the lowest socioeconomic group (Q5) in 2009–10 and 2011–12 rose above those in the same socioeconomic group in Ontario. The absolute rate difference or gap between Q1 and Q5 in Middlesex-London was significantly larger than in Ontario in the most recent time points and the gap is widening. These differences existed within an overall increase in mental health emergency department visits during the time period examined.
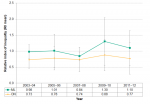
The socioeconomic difference in mental health emergency department visits when the whole population is taken into consideration was high in Middlesex-London in 2011–12 (1.73). However, unlike the absolute rate difference, it was not significantly different than the inequality experienced across Ontario (0.92) based on the relative index of inequality (Figure 2.6.3).
The relative index of inequality was lowest in 2007–08 for both Middlesex-London and Ontario and has increased since that time. While the inequalities have persisted, no significant change overtime in the relative inequalities in mental health related emergency department visits has occurred in the period reviewed from 2003–04 to 2011–12 (Figure 2.6.3).
Over fifty percent of all mental health related emergency department visits could be eliminated in Middlesex-London if health inequities did not exist. Specifically, 7,007 visits of the 13,669 visits of the mental health related emergency department visits could have been avoided in Middlesex-London in 2011–12, if each socioeconomic group (based on material deprivation quintiles) experienced the rate of the most advantaged group (Figure 2.6.4).
Interpretation
Public health is mandated to provide mental health promotion activities to reduce the burden of mental illness and improve well-being.2 The mental health emergency department visits indicator includes substance-related disorders; schizophrenic, delusional and non-organic psychotic disorders; mood/affective disorders; anxiety disorders; and personality disorders.
The relative index of inequality describes the gradient of health, or average change across the socio-economic groups relative to the average health of the whole population. Here it indicates the extent to which health outcomes were worse in residents of each socio-economic strata of the more materially deprived neighbourhoods in Middlesex-London. An RII (mean) of zero would suggest no difference between groups and indicate equality; the higher the RII (mean) value, the greater the gradient between groups, indicating inequality.
One way to understand the RII (mean) is to consider the average change in the health outcome with each increasing deprivation quintile. For example, for mental health emergency department visits, the average hospitalization rate for Middlesex-London in 2011–12 is 1,863.3 per 100,000 population. The RII (mean) of 1.73 could be interpreted as with each increasing quintile, the hospitalization rate increases on average by: 1.73 * 1,863.3 / 5. i.e., with each increase in quintile, the rate increases by approximately 645 visits per 100,000.
Alcohol Attributable Hospitalization
Significant differences in alcohol attributable hospitalization existed between residents living in neighbourhoods with differing levels of socio-economic status in Middlesex-London. Residents living in well-off neighbourhoods with the least material deprivation (i.e., Q1) had a significantly lower rate of 47.2 compared to 132.0 per 100,000 population aged 15 and over for those living in neighbourhoods with the most material deprivation; a rate difference of 84.8 per 100,000 in Middlesex-London, averaged for the two-year period 2011 to 2012 (Figure 2.6.5).
Figure 2.6.6 shows the rate of alcohol attributable hospitalizations for residents in low socioeconomic status versus high socioeconomic status neighbourhoods in Middlesex-London compared to Ontario over time. Generally, the inequalities between Q1 and Q5 persisted for both Middlesex-London and Ontario for all years. However, there were no significant difference between Middlesex-London and Ontario based on the absolute rate differences. During the time period reviewed, there were overall increases in alcohol attributable hospitalizations.
Similarly, relative differences are slightly higher in Middlesex-London but not significantly different than those experienced across Ontario based on the relative index of inequality (mean) (Figure 2.6.7).
Over forty percent of all alcohol attributed hospitalizations could be eliminated in Middlesex-London if health inequities did not exist. Specifically, 255 of the 592 cases of alcohol attributed hospitalizations could have been avoided in Middlesex-London in 2011–12, if each socioeconomic group (based on local material deprivation quintiles) experienced the rate of the most advantaged group (Figure 2.6.4).
Interpretation
Public health is mandated to prevent the burden of alcohol use including increasing healthy living behaviours and personal skills development.2 The alcohol-attributable hospitalization indicator assesses conditions where the cause of the condition is 100% attributable to alcohol use based on research. The most common reason for hospitalization for an alcohol-attributable disease or condition is mental and behavioural disorders (e.g., acute intoxication, withdrawal, dependence syndrome) which make up approximately 60% of all alcohol-attributable hospitalizations.5
Potentially Avoidable Mortality
Significant differences in potentially avoidable mortality existed between populations living in neighbourhoods with differing levels of socio-economic status within Middlesex-London. Residents living in well-off neighbourhoods with the least material deprivation (i.e., Q1) had an age standardized avoidable death rate of 125.8 compared to 314.5 per 100,000 population aged 0 to 75 for those living in neighbourhoods with the most material deprivation. This is an absolute rate difference of 188.7 per 100,000 in Middlesex-London for the two-year period 2011 to 2012 (Figure 2.6.8).
Figure 2.6.9 shows the potentially avoidable deaths for low socioeconomic status versus high socioeconomic status in Middlesex-London compared to Ontario over time. Generally, the inequalities between Q1 and Q5 persisted for both Middlesex-London and Ontario for all years. There was a significant difference in 2009–10 between Middlesex-London and Ontario based on the absolute rate differences. These inequalities persist despite small but steady improvements in overall avoidable mortality in the population during this same time period.
Relative differences are slightly higher but not significantly different than those experienced across Ontario as a whole based on the relative index of inequality (Figure 2.6.10).
The relative index of inequality was lowest in 2007–08 and has increased since that time, but differences in potentially avoidable mortality have not changed significantly since 2003–04 (Figure 2.6.10).
Approximately forty percent of all potentially avoidable deaths could be eliminated in Middlesex-London if health inequities did not exist. Specifically, 678 of the 1,687 deaths due to potentially avoidable causes could have been avoided in Middlesex-London in 2011–12, if each socioeconomic group (based on local material deprivation quintiles) experienced the rate of the most advantaged group (Figure 2.6.4).
Interpretation
The potentially avoidable mortality indicator assesses deaths that occur in people before the age of 75 due to causes that could have been potentially avoided through prevention practices, public health policies, and the provision of timely and effective health care. Avoidable mortality accounts for approximately 72% of all premature deaths.7
Low Birth Weight
Significant differences in low birth weight rates existed within Middlesex-London for the first time in 2007–08 since 2003–04, between residents living in neighbourhoods with differing levels of socio-economic status. Residents living in well-off neighbourhoods in 2011–12 with the least material deprivation (i.e., Q1) had a low birth weight rate of 3.5 compared to 5.7 low birthweight births per 100 singleton births for those living in neighbourhoods with the most material deprivation. This is an absolute rate difference of 2.2 per 100 singleton births in Middlesex-London (Figure 2.6.11).
Figure 2.6.12 shows the low birth weight rate for low socioeconomic status versus high socioeconomic status in Middlesex-London compared to Ontario over time. There were no income inequalities in the absolute rate difference in low birth weight rate in Middlesex-London until 2007–08, despite there being a significant difference in Ontario overall. There were no significant differences in the rate difference between Middlesex-London and Ontario over the time period. Overall, the low birth weight rate was relatively steady within the time period.
When the whole population is taken into consideration, relative inequalities in low birth weight rate in Middlesex-London were actually steady until 2009–10 when inequalities in both Middlesex-London and the province as a whole increased based on the relative index of inequality. The inequality continued to increase in 2011–12 in Middlesex-London and was slightly higher but not significantly different than that experienced across Ontario (Figure 2.6.13).
Just under twenty percent of all potentially avoidable singleton low birth weight births could be eliminated in Middlesex-London if health inequities did not exist. Specifically, 64 of the 381 low birth weigh births could have been prevented in Middlesex-London in 2011–12, if each socioeconomic group (based on local material deprivation quintiles) experienced the rate of low birth weight of the most advantaged group (Figure 2.6.4).
Interpretation
A goal of public health is to achieve optimal preconception, pregnancy and newborn health.2 Risk factors during preconception and pregnancy can lead to the adverse health outcome of low birth weight. This low birth weight rate indicator assesses the crude rate of singleton live births less than 2,500 g. Being born small is an indicator of newborn and maternal health, and an important predictor of health outcomes during childhood and adulthood.5
Both absolute and relative measures of health inequality are important to consider when undertaking population health assessment and reporting of health inequities.8,9 Population health assessment has typically identified inequalities in subgroups by measuring the absolute difference or gap between the lowest and highest socioeconomic groups. The information in this section includes an assessment of absolute measures to answer the question, “how big is the inequality gap?” as well as a way to consider, “how steep is the gradient of inequality?” by assessing income-related differences within the entire population. The relative index of inequality (RII (mean)) considers data from not only the lowest and highest socioeconomic group but data from all the groups in between and therefore reflects the true gradient across the entire population. Unlike absolute measures of health differences, the RII (mean) is independent of the original units of the indicator and therefore can be compared directly between geographic groups and across health outcomes that may be measured on very different scales.10 The RII (mean) is a regression-based index that compares the theoretically worst-off individual in a population and the theoretically best-off individual in the same population relative to the mean. An RII (mean) of zero would suggest no difference between groups and indicate equality; the higher the RII (mean) value, the greater the gradient between groups, indicating inequality. In addition to absolute and relative measures of income-related inequality, this section also provides the population impact number which is the projected reduction in the number of cases of a health indicator if each socioeconomic group experienced the rate of the most advantaged group, expressed as a count.
Any potential affect due to the population’s age structure has been controlled for by age-standardizing all of these indicators.
Differences in the rate of mental health emergency department visits and alcohol-attributable hospitalization may reflect underlying differences in the health of the population as well as service availability and accessibility.5
Socioeconomic status quintiles were assigned using the neighbourhood proxy measure of material deprivation from the Ontario Marginalization (ON-Marg) Index. Material deprivation divides neighbourhoods into five equal groups based on the neighbourhood’s ability to attain basic material needs, assessed using census indicators such as education, income and unemployment-related characteristics.11 Neighbourhoods in the first quintile, Q1, are most well-off and experience the least deprivation, whereas neighbourhoods in the fifth quintile, Q5, are least well-off and experience the most deprivation. The 2007-2008 health status data are assigned to 2006 ON-Marg quintiles, and 2009-2012 health status data are assigned to 2011 ON-Marg quintiles.12
Ontario Public Health Standards: Requirements for Programs, Services, and Accountability
Population Health Assessment and Surveillance Protocol, 2018
References:
1. Ontario Ministry of Health and Long-Term Care. Improving the odds: championing health equity in Ontario – 2016 annual report of the Chief Medical Officer of Health of Ontario to the legislative assembly of Ontario [Internet]. Toronto (ON): Queen’s Printer for Ontario; 2018 Feb [cited 2019 Feb 20]. 27 p. Available from: http://www.health.gov.on.ca/en/common/ministry/publications/reports/cmoh...
2. Ontario Ministry of Health and Long-Term Care. Protecting and promoting the health of Ontarians. Ontario public health standards: requirements for programs, services, and accountability [Internet]. Toronto (ON): Queen’s Printer for Ontario; 2018 [cited 2019 Feb 9]. 75 p. Available from: http://health.gov.on.ca/en/pro/programs/publichealth/oph_standards/docs...
3. Ontario Ministry of Health and Long-Term Care. Health equity guideline [Internet]. Toronto (ON): Queen’s Printer for Ontario; 2018 [cited 2019 Feb 9]. 20 p. Available from: http://www.health.gov.on.ca/en/pro/programs/publichealth/oph_standards/d...
4. Public Health Ontario [Internet]. Toronto (ON): Ontario Agency for Health Protection and Promotion; c2019. Snapshots; [updated 2019 Feb 21; cited 2019 Mar 29]; [about 2 screens]. Available from: https://www.publichealthontario.ca/en/data-and-analysis/commonly-used-pr...
5. Canadian Institute for Health Information. Trends in income-related health inequalities in Canada: technical report [Internet]. Ottawa (ON): Canadian Institute for Health Information; 2015 Nov 18 [revised 2016 Jul 7; cited 2019 Mar 28]. 183 p. Available from: https://secure.cihi.ca/free_products/trends_in_income_related_inequaliti...
6. Scottish Government, Healthy Analytical Services Division. Long-term monitoring of health inequalities: first report on headline indicators [Internet]. Edinburgh (GB): Scottish Government; 2008 Sep [cited 2019 Mar 27]. 37 p. Available from: https://www.webarchive.org.uk/wayback/archive/20170106051549/http://www....
7. Statistics Canada; Canadian Institute for Health Information. Health indicators 2012 [Internet]. Ottawa (ON): Canadian Institute for Health Information; c2012. In focus: avoidable mortality in Canada; [cited 2019 Mar 27]; 128 p. Available from: https://secure.cihi.ca/free_products/health_indicators_2012_en.pdf
8. Salter K, Lambert T, Antonello D, Cohen B, Janzen Le Ber M, Kothari A, Lemieux S, Moran K, Pellizzari Salvaterra R, Robson J, Wai C. Health equity indicators for Ontario local public health agencies: user guide [Internet]. Toronto (ON): Ontario Agency for Health Protection and Promotion; 2016 Apr [cited 2019 Mar 27]. 70 p. Available from:
http://nccdh.ca/images/uploads/comments/Health_Equity_Indicators_for_Ont...
9. Regidor E. Measures of health inequalities: part 2. J Epidemiol Community Health [Internet]. 2004 [cited 2019 Mar 25];58(11):900-3. Available from: http://dx.doi.org/10.1136/jech.2004.023036
10. Buajitti E, Chiodo S, Watson T, Kornas K, Bornbaum C, Henry D, Rosella LC. Ontario atlas of adult mortality, 1992-2015 [Internet]. Version 2.0: trends in public health units. Toronto (ON): Population Health Analytics Lab; 2018 [cited 2019 Mar 25]. 87 p. Available from: https://pophealthanalytics.com/wp-content/uploads/2018/09/OntarioAtlasOf...
11. Matheson FI, Moloney G, van Ingen T. 2016 Ontario marginalization index: user guide [Internet]. Toronto (ON): St. Michael’s Healthcare; 2018 Oct [cited 2019 Feb 20]. 23 p. Available from: https://www.publichealthontario.ca/en/eRepository/userguide-on-marg.pdf Jointly published by Public Health Ontario.
12. Ontario Agency for Health Protection and Promotion. Snapshots technical notes: health inequities in alcohol-attributable hospitalizations [Internet]. Toronto (ON): Ontario Agency for Health Protection and Promotion; [2018?] [cited 2019 Mar 29]. 6 p. Available from: https://ws1.publichealthontario.ca/appdata/Snapshots/Alcohol%20Attributa...
Last modified on: May 7, 2019
Jargon Explained
Health Inequality/inequity
Health inequalities are differences in health status between groups. Health inequities are inequalities that are unjust, avoidable, and systematic, and have the potential to be decreased by social action.
Material deprivation
is an area (neighbourhood) based summary measure that assesses the resident’s ability to attain basic needs by simultaneously considering the neighbourhood’s education, employment, income, housing conditions and family structure. 1
1. Matheson, FI; Ontario Agency for Health Protection and Promotion (Public Health Ontario). 2016 Ontario marginalization index: user guide. Toronto, ON: Providence St. Joseph’s and St. Michael’s Healthcare; 2018. Joint publication with Public Health Ontario. https://www.publichealthontario.ca...


