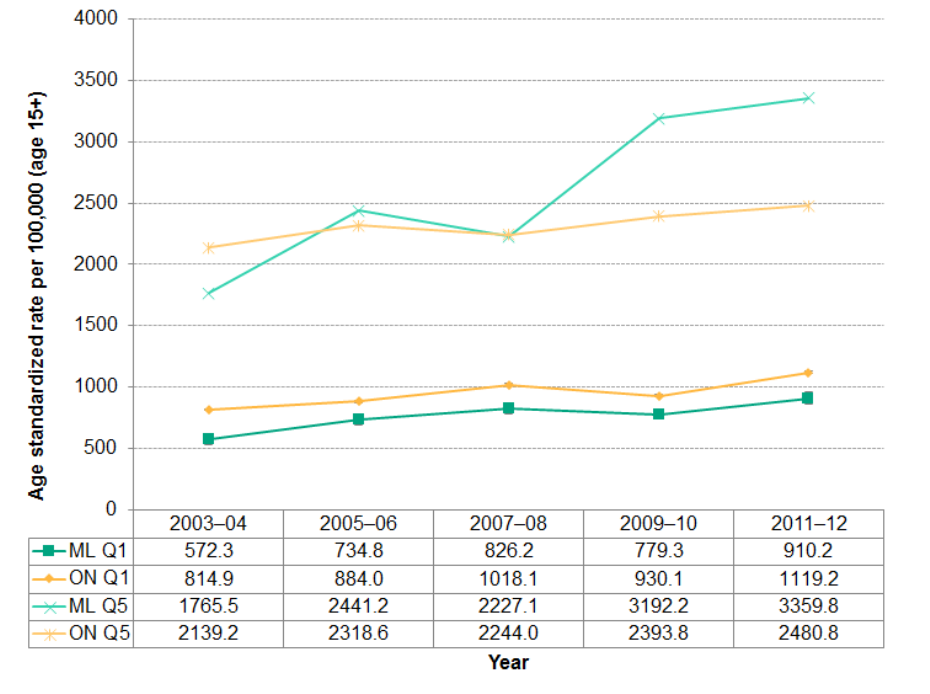
Figure 2.6.2: Mental health emergency department visits rate in quintiles Q1 and Q5
Age- standardized rate per 100,000 (age 15+) Middlesex-London and Ontario, 2003–04 to 2011–12 annual average

Source:
Public Health Ontario. Snapshots: Middlesex-London Health Unit: Health Inequities in Mental Health Emergency Department Visits 2003-12. Toronto, ON: Ontario Agency for Health Protection and Promotion; 2018 May 9 [2019 Mar 15]. Available from: http://www.publichealthontario.ca/en/DataAndAnalytics/Snapshots/Pages/Me...
National Ambulatory Care Reporting System (NACRS), 2003-2012, Ontario Ministry of Health and Long-Term Care, IntelliHEALTH ONTARIO, Date extracted: 2018 February 14
The rates in Middlesex-London for those in the highest socioeconomic group (Q1) are consistently lower than Ontario over time. However, the rates in Middlesex-London for those in the lowest socioeconomic group (Q5) in 2009–10 and 2011–12 rose above those in the same socioeconomic group in Ontario. The absolute rate difference or gap between Q1 and Q5 in Middlesex-London was significantly larger than in Ontario in the most recent time points and the gap is widening. These differences existed within an overall increase in mental health emergency department visits during the time period examined.