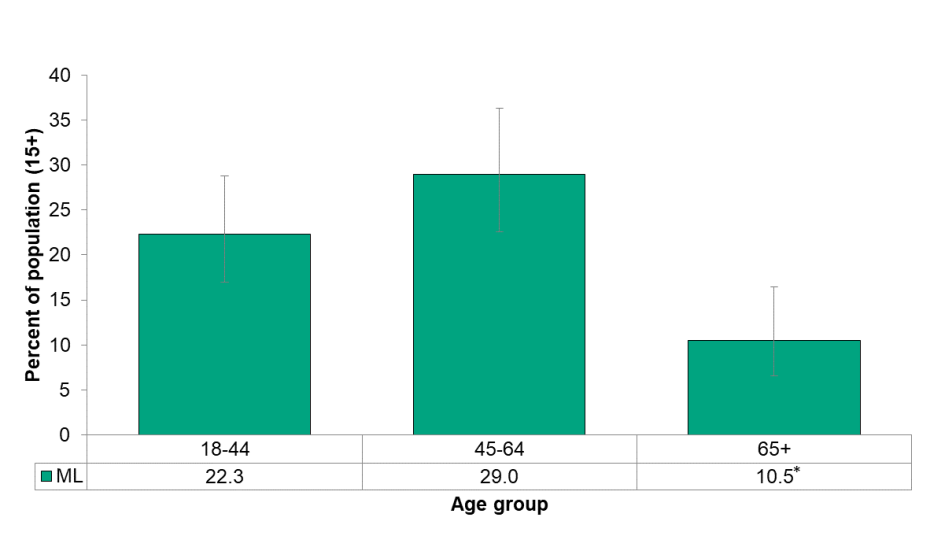
Figure 6.4.2: Life stress by age group
Percent of population (+15) who reported most days as quite stressful or extremely stressful in the past 12 months, Middlesex-London, 2015/16

Source:
Canadian Community Health Survey [2015-16], Statistics Canada, Share File, Ontario Ministry of Health and Long-Term CareNote:
*Estimate should be interpreted with caution due to high variability
Those 65 years and older reported a much lower rate of life stress (10.5%) than those in younger age groups such as 45–64 years (29.0%) and 18–44 years (22.3%). This difference was statistically significant.