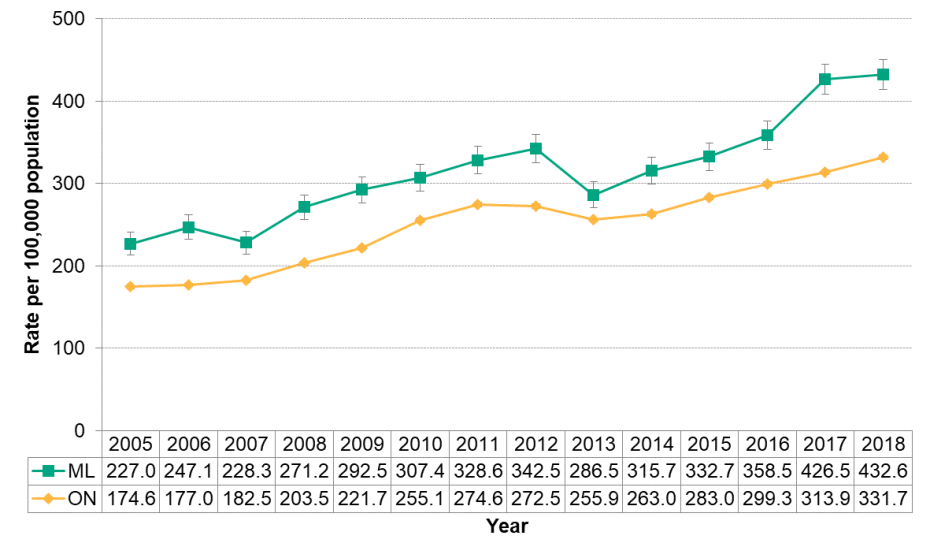
Figure 9.1.4: Chlamydia by year
Rate of chlamydia infections reported per 100,000 population, Middlesex-London and Ontario, 2005 to 2018

Source:
Public Health Ontario Infectious Disease Query: Middlesex-London Health Unit: Case counts and crude rates of reportable diseases by year. Toronto ON: Ontario Agency for Health Protection and Promotion; 2019 May 1 [cited 2019 May 7].The rate of chlamydia infections significantly increased among Middlesex-London residents and across Ontario, nearly doubling between 2005 and 2018.
In all years, the local rate was significantly higher than the provincial rate.