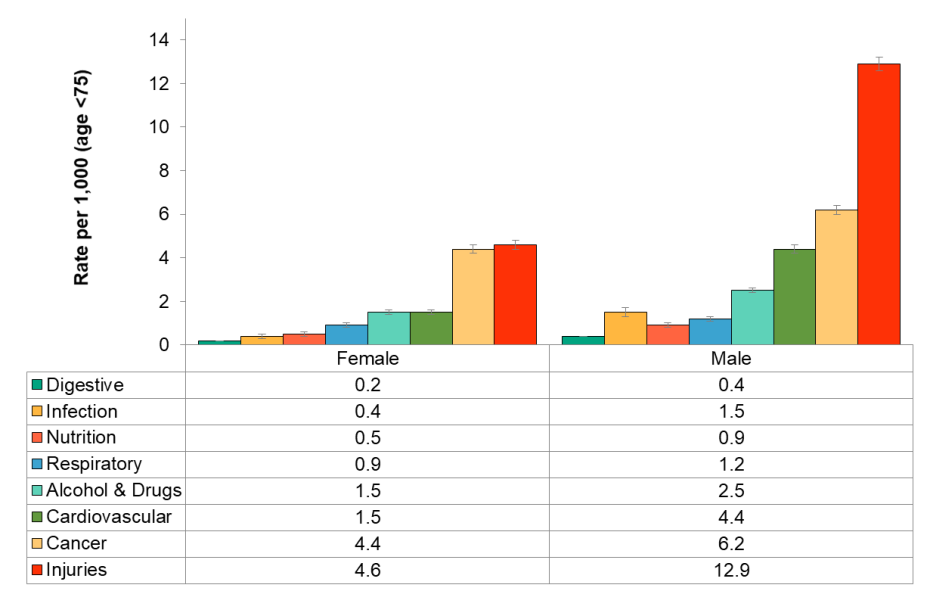
Figure 3.6.5: Preventable potential years of life lost by cause group by sex, rate per 1,000, age <75
Middlesex-London, 2013–2015 annual average

Source:
Ontario Inpatient Discharges Data, Ontario Ministry of Health and Long‐Term Care, IntelliHEALTH ONTARIO, Date Extracted: September 16, 2011; Population Estimates, Ontario Ministry of Health and Long-Term Care, IntelliHEALTH Ontario, Date Extracted: April 14, 2011Males, more so than females, contributed to high rates of injury related PYLL. Much of the higher burden of preventable PYLL in males compared to females is related to the substantially higher rates of PYLL due to injury and to a smaller degree to cardiovascular disease in males compared to females.