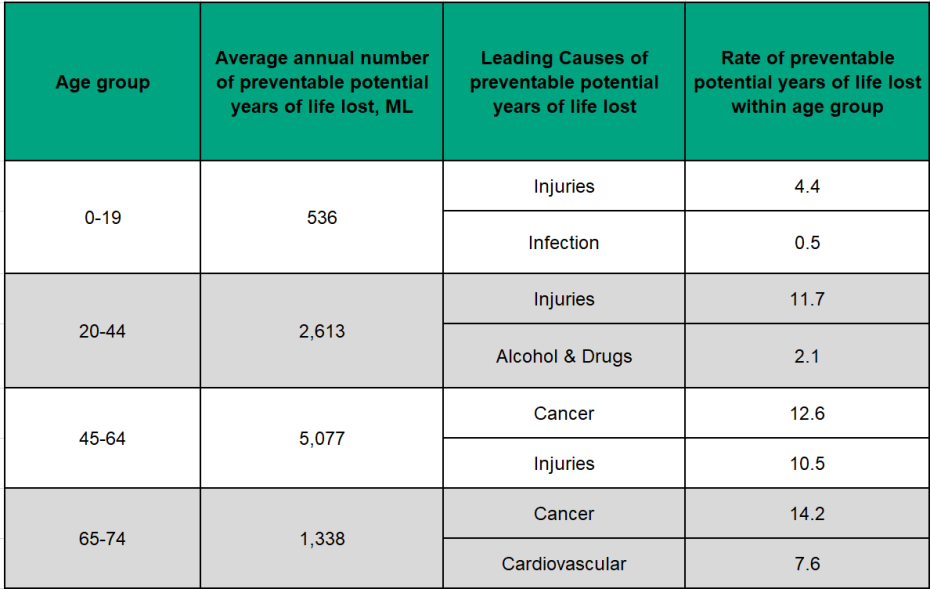
Figure 3.6.6: Preventable potential years of life lost by cause group by age group, rate per 1,000, age <75
Middlesex-London, 2013–2015 annual average

Source:
Ontario Mortality Data, Ontario Ministry of Health and Long-Term Care, IntelliHEALTH ONTARIO, Date Extracted: April 26, 2019; Population Estimates, Ontario Ministry of Health and Long-Term Care, IntelliHEALTH Ontario, Date Extracted: May 26, 2018The top causes of potential years of life lost varies considerably by age. The top two by age group were exactly the same as were found for preventable mortality. Injuries by far contributed the greatest burden to PYLL for those aged 0-19 followed by infection from 2013 to 2015. For those aged 20-44, injuries also contributed the greatest burden of PYLL followed by alcohol and drugs. In those aged 45-64, injury slipped to second place behind cancer and in those 65-74, cancer and cardiovascular disease contributed the greatest burden of PYLL.