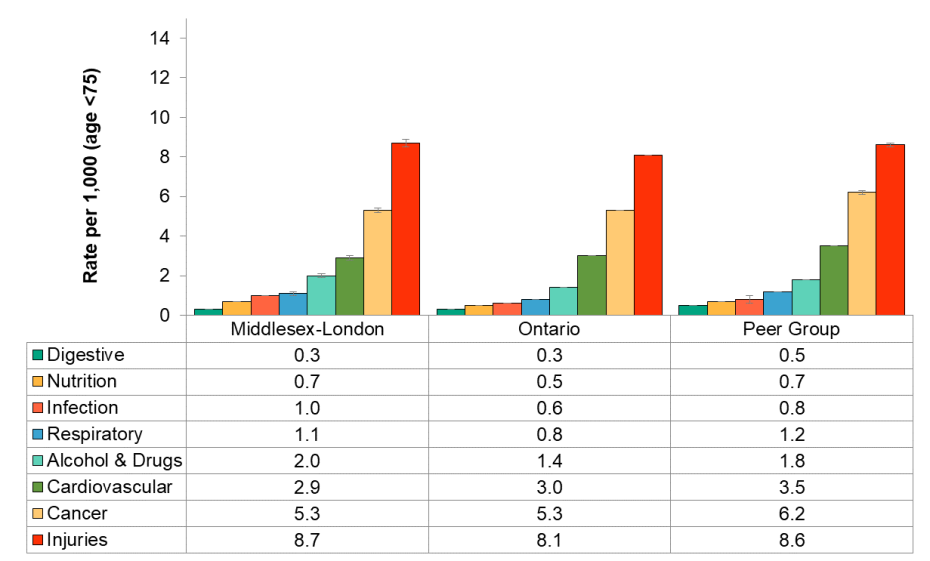
Figure 3.6.4: Preventable potential years of life lost by cause group, rate per 1,000, age <75
Middlesex-London, Ontario Peer Group, 2013–2015 annual average

Source:
Ontario Mortality Data, Ontario Ministry of Health and Long-Term Care, IntelliHEALTH ONTARIO, Date Extracted: April 26, 2019; Population Estimates, Ontario Ministry of Health and Long-Term Care, IntelliHEALTH Ontario, Date Extracted: May 26, 2018Injuries, followed by cancer and cardiovascular disease, had the highest preventable potential years of life lost (PYLL) rates on average from 2013 to 2015, for all three jurisdictions: Middlesex-London, Ontario and the Peer Group.