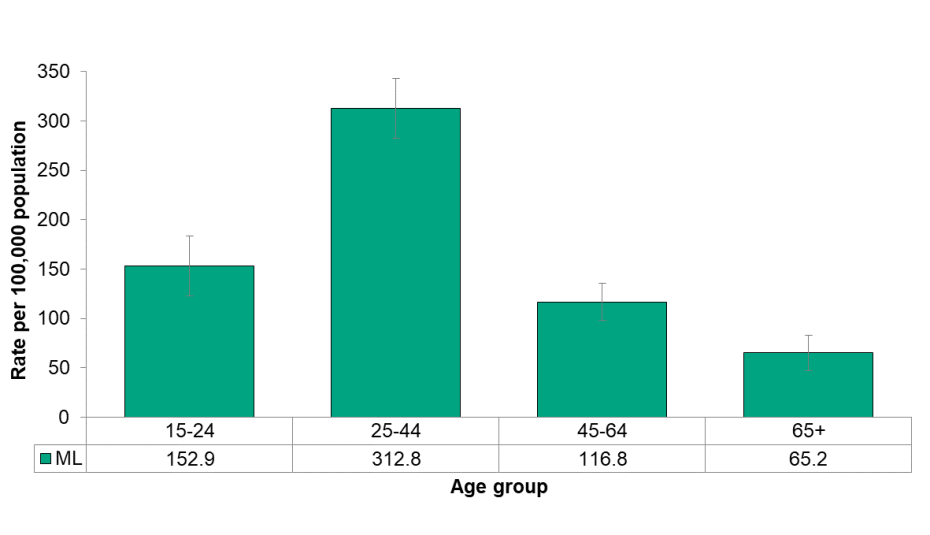
Figure 5.4.7: Opioid-Related ED Visits by Age Group
Age specific rates per 100,000 population by age group, Middlesex-London, 2017

Source:
Ambulatory Emergency External Cause [2017], Ontario Ministry of Health and Long-Term Care, IntelliHEALTH ONTARIO, Date Extracted: Jan 24, 2019; Population Estimates [2017], Ontario Ministry of Health and Long-Term Care, IntelliHEALTH Ontario, Date Extracted: May 22, 2018Those in the 25–44 age group had significantly higher rates of ED visits for opioids (312.8 per 100,000) than any other age group. It was more than twice both the 15–24 age group (152.9) and the 45–64 age group (116.8).
This pattern is different than what is observed in opioid-related deaths where the 45–64 age group has the highest mortality, followed by the 25–44 group (Figure 5.4.2).