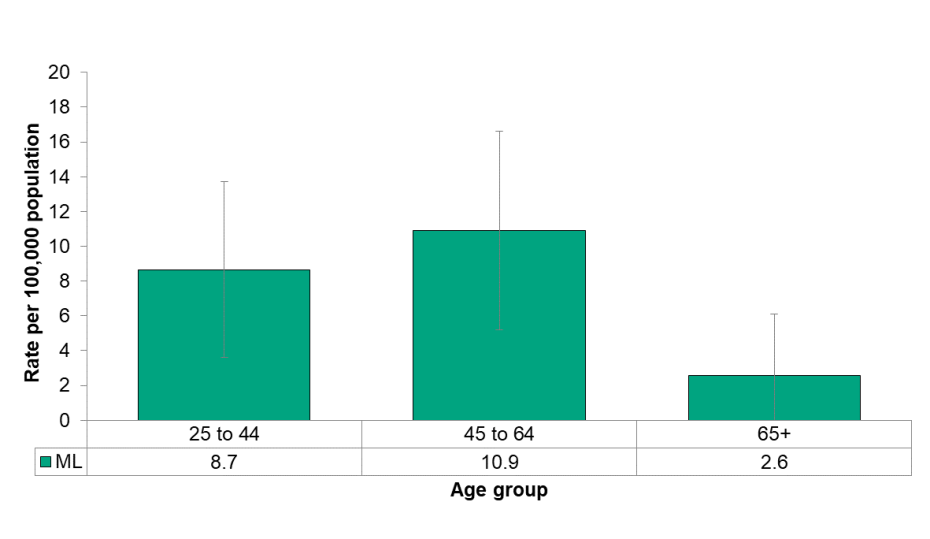
Figure 5.4.2: Deaths Related to Opioids Poisonings by Age Group
Rate per 100,000 population, Middlesex-London, 2015–2017 average

Source:
Ontario Agency for Health Protection and Promotion (Public Health Ontario). Interactive Opioid Tool. Toronto, ON: Queen’s Printer for Ontario; 2018. Extracted on Jan 30, 2019. Available from: https://www.publichealthontario.ca/en/data-and-analysis/substance-use/interactive-opioid-tool# Although the differences between age groups were not significant, those in the 45–64 age group had the highest rate of death, followed by those in the 25–44 age group.