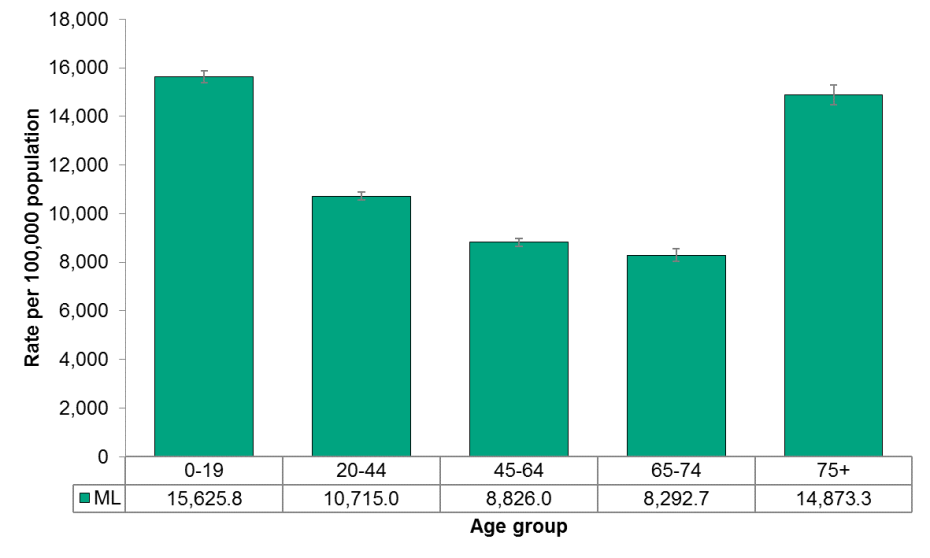
Figure 4.1.4: Emergency department visits from unintentional injury by age group
Rates per 100,000 population, by age group, Middlesex-London, 2017

Source:
Ambulatory Emergency External Cause [2017], Ontario Ministry of Health and Long-Term Care, IntelliHEALTH ONTARIO, Date Extracted: Nov 2, 2018; Population Estimates [2017], Ontario Ministry of Health and Long-Term Care, IntelliHEALTH Ontario, Date Extracted: May 22, 2018Age-specific emergency department visit rates for unintended injuries in Middlesex-London follow a U-shaped pattern, indicating that visits for injuries were highest in the youngest and oldest in our population in 2017.
Age-standardized emergency department visit rates were significantly higher among males than females (not shown).