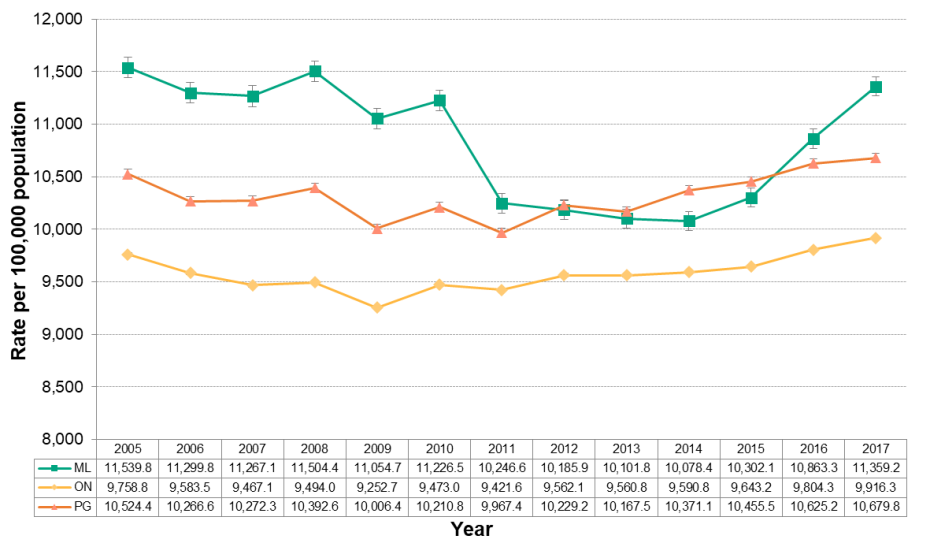
Figure 4.1.3: Emergency department visits for unintentional injury
Age-standardized rate per 100,000 population, Middlesex-London, Ontario and Peer Group, 2005 to 2017

Source:
Ontario Agency for Health Protection and Promotion (Public Health Ontario). Snapshots: Emergency department visits for all unintentional injuries – age standardized rate (both sexes) 2005-2016 [Internet]. Toronto, ON: Queen’s Printer for Ontario; [updated 2018 Mar 29; cited 2018 Nov 06]. Available from: https://www.publichealthontario.ca/en/DataAndAnalytics/Snapshots/Pages/Injury-ED-Visits.aspx; Ambulatory Emergency External Cause [2017], Ontario Ministry of Health and Long-Term Care, IntelliHEALTH ONTARIO, Date Extracted: Nov 2, 2018; Population Estimates [2017], Ontario Ministry of Health and Long-Term Care, IntelliHEALTH Ontario, Date Extracted: May 22, 2018
Between 2005 and 2014 emergency department visits for unintentional injury significantly decreased in Middlesex-London, however they began to increase again in 2015. By 2017 the rates had increased to levels seen 10 years earlier.
A similar trend was seen with an increase in the Ontario and Peer Group rates between 2013 and 2017.
The rate of emergency department visits for all unintentional injuries in Middlesex London was higher (11,359.2 per 100,000) than both comparators: Ontario (9,916.3) and the Peer Group (10,679.8) in 2017.