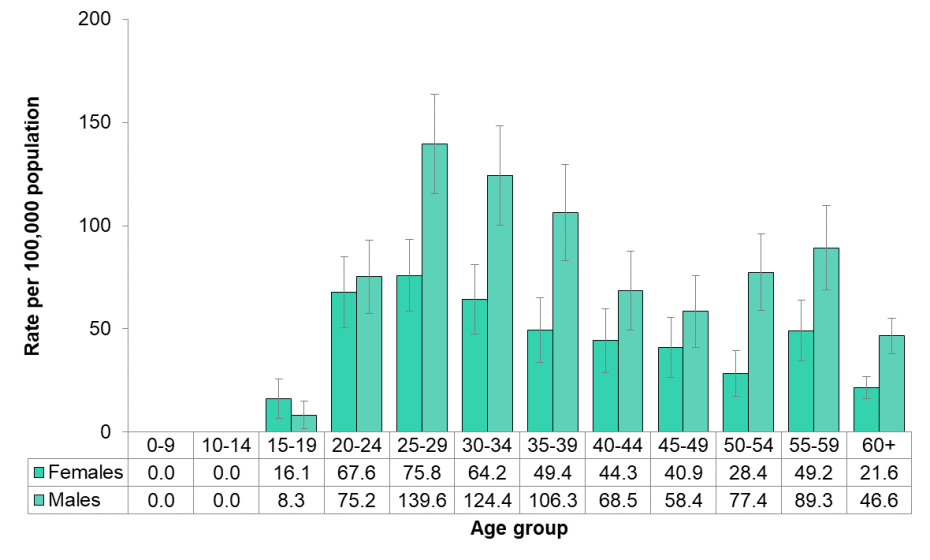
Figure 9.1.9: Hepatitis C by age and sex
Rate of hepatitis C infections reported per 100,000 population by age and sex, Middlesex-London, 2014 to 2018 annual average

Source:
Public Health Ontario Infectious Disease Query: Middlesex-London Health Unit: Case counts and crude rates of reportable diseases by year. Toronto ON: Ontario Agency for Health Protection and Promotion; 2019 May 8 [cited 2019 May 13].For both females and males, the rate of hepatitis C infections was highest among those 25-29 years of age.
Among the 25-29, 30-34 and 35-39 year-old age groups, the rate among males was significantly higher than among females.
Significant differences between males and females also existed in all age groups 50 years of age and over.