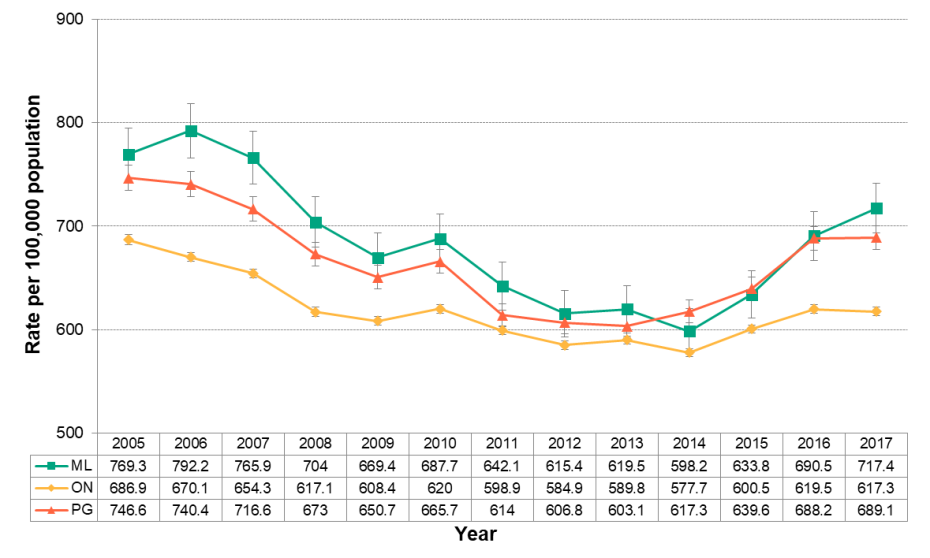
Figure 4.4.4: Emergency department visits from motor vehicle collisions
Age-standardized rates per 100,000 population, Middlesex-London, Ontario and Peer Group, 2005 to 2017

Source:
Ontario Agency for Health Protection and Promotion (Public Health Ontario). Snapshots: Emergency department visits for all unintentional injuries – age standardized rate (both sexes) 2005-2016 [Internet]. Toronto, ON: Queen’s Printer for Ontario; [updated 2018 Mar 29; cited 2018 Nov 06]. Available from: https://www.publichealthontario.ca/en/DataAndAnalytics/Snapshots/Pages/Injury-ED-Visits.aspx; Ambulatory Emergency External Cause [2017], Ontario Ministry of Health and Long-Term Care, IntelliHEALTH ONTARIO, Date Extracted: Nov 2, 2018; Population Estimates [2017], Ontario Ministry of Health and Long-Term Care, IntelliHEALTH Ontario, Date Extracted: May 22, 2018
The rate of MVCs-related emergency department visits declined significantly between 2005 and 2014, but then began to rise again.
The current trend is upward and the rate seen in 2017 (717.4 per 100,000) was similar to that seen in 2010, erasing any gains of reduced MVC injuries seen in the years between. An increasing trend was also seen in the provincial and Peer Group rates.
Rates of deaths due to MVCs also showed a decline over the time period of 2005 to 2010 but then began to rise in 2011 and 2012 for ML or the other comparators, although not significantly.