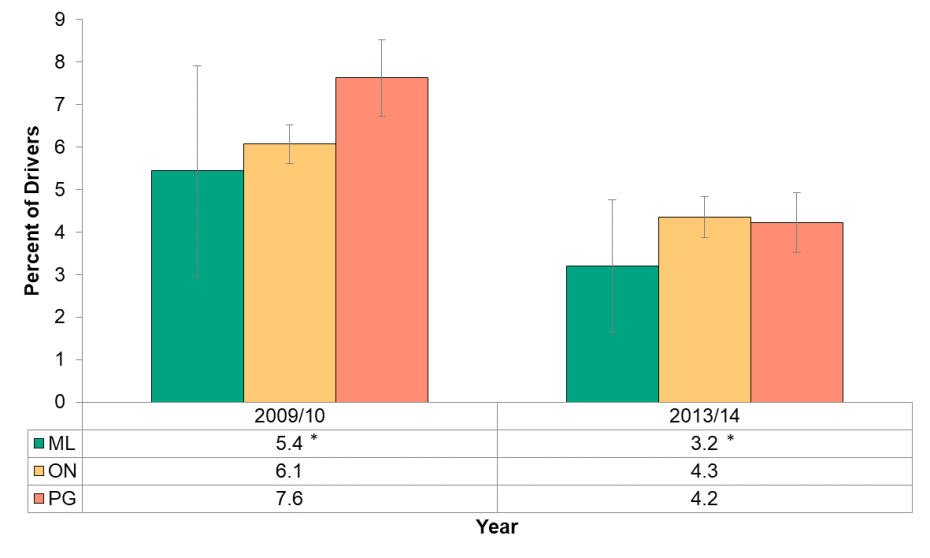
Figure 4.4.12: Drivers that drove a motor vehicle after having two or more drinks in the hour before they drove in the past 12 months
Percent of drivers (age 16+), Middlesex-London, Ontario and Peer Group, 2009/10, 2013/14

In 2013/14 the proportion of people who reported that they drove after consuming two or more drinks in the hour before they drove was 3.2% in Middlesex-London.
This was lower than in 2009/10. Although the decrease was not statistically significant in Middlesex-London, a significant decrease was seen in both Ontario and the Peer Group proportions.
Males were considerably more likely to drink and drive compared to females and a similar difference was seen in Middlesex-London, the Peer Group and Ontario. The estimates for Middlesex-London were too small to report, but in Ontario 7.2% of males reported drinking and driving compared to 1.1% among females (not shown).