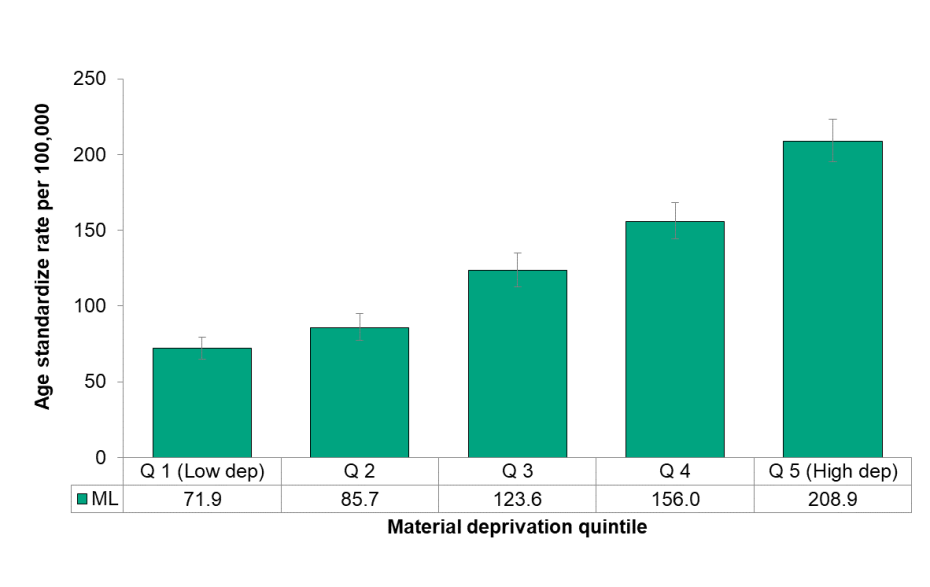
Figure 3.5.3: Preventable mortality by material deprivation quintile, (age <75), age standardized rate per 100,000 population
Middlesex-London, 2011-15 average

Source: Ontario Mortality Data, Ontario Ministry of Health and Long-Term Care, IntelliHEALTH ONTARIO, Date Extracted: April 26, 2019; 2016 census of population – dissemination area: Census profile - age and sex for Canada, provinces, territories, census divisions, census subdivisions and dissemination areas, 2016 census [Internet]. Ottawa, ON: Statistics Canada; 2017 Nov 29, Date Extracted Dec 12, 2018 ,2016 Ontario marginalization index. Toronto, ON: Providence St. Joseph’s and St. Michael’s Healthcare; 2018. Joint publication with Public Health Ontario.
Preventable mortality increased with each material deprivation quintile and varied significantly by material deprivation quintile on average from 2011 to 2015. The rate for those that lived in the most well-off neighbourhoods was more than half (Q1 the least material deprived neighbourhoods; 71.9 per 100,000) that of the most materially deprived neighbourhoods (Q5 most material deprived neighbourhoods; 208.9 per 100,000). This is a rate difference of 137.0 deaths on average from 2011 to 2015.