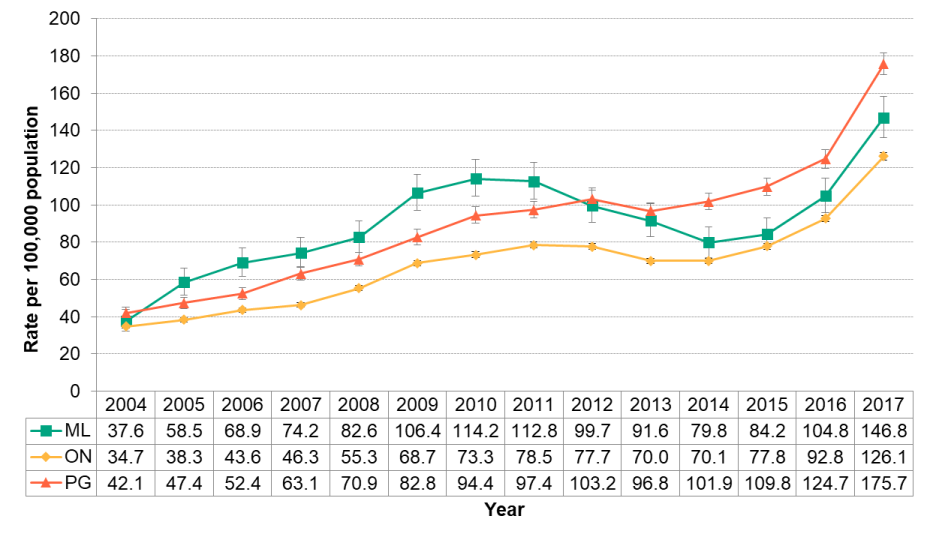
Figure 5.4.4: Opioid-Related ED Visits
Age standardized rates per 100,000 population, Middlesex-London, Ontario and Peer Group, 2004 to 2017

Source:
Ambulatory Emergency External Cause [2017], Ontario Ministry of Health and Long-Term Care, IntelliHEALTH ONTARIO, Date Extracted: Jan 24, 2019; Population Estimates [2017], Ontario Ministry of Health and Long-Term Care, IntelliHEALTH Ontario, Date Extracted: May 22, 2018The rate of emergency department visits related to opioids increased significantly between 2014 (79.8 per 100,000) and 2017 (146.8 per 100,000) after declining between 2010 and 2014. A similar pattern was seen in Ontario.