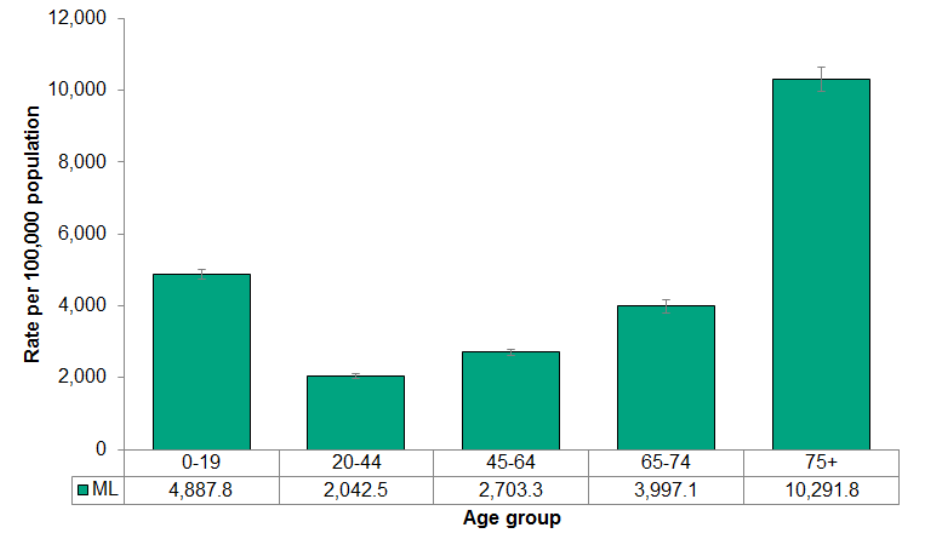
Figure 4.3.5: Emergency Department visits from falls by age group
Rates per 100,000 population, Middlesex-London, 2017

Source:
Ambulatory Emergency External Cause [2017], Ontario Ministry of Health and Long-Term Care, IntelliHEALTH ONTARIO, Date Extracted: Nov 2, 2018; Population Estimates [2017], Ontario Ministry of Health and Long-Term Care, IntelliHEALTH Ontario, Date Extracted: May 22, 2018The age-specific rates of ED visits due to falls were lowest in the age group 20-44. The rates increased dramatically after age 74.