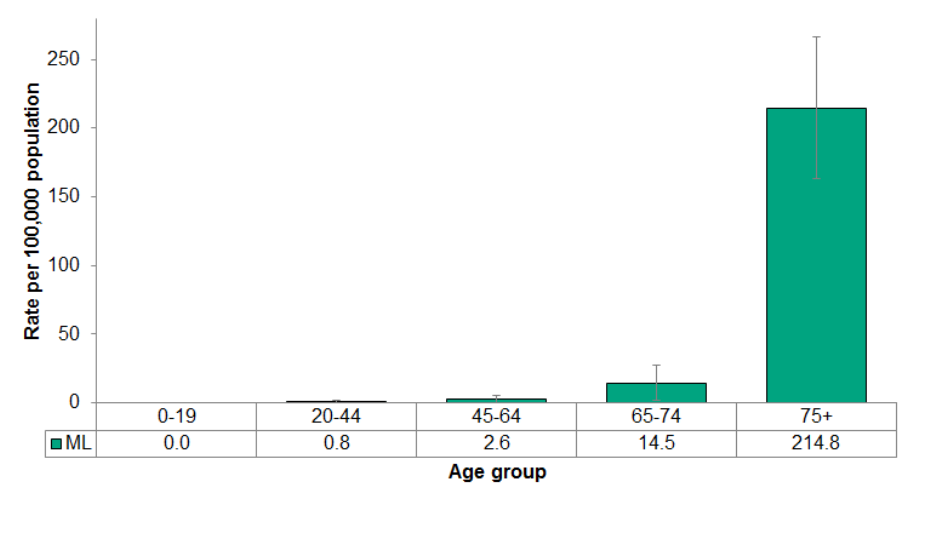
Figure 4.3.3: Deaths from falls by age group
Rates per 100,000 population, Middlesex-London, 2010-2012 annual average

Source:
Ontario Mortality Data [2010-2012], Ontario Ministry of Health and Long-Term Care, IntelliHEALTH Ontario, Date Extracted: Oct 26, 2018; Population Estimates [2010-2012], Ontario Ministry of Health and Long-Term Care, IntelliHEALTH Ontario, Date Extracted: May 22, 2018Death rates due to falls increased as age increased, increasing dramatically after age 75 (214.8 per 100,000).
There were no differences seen between sexes or by urban/rural status.