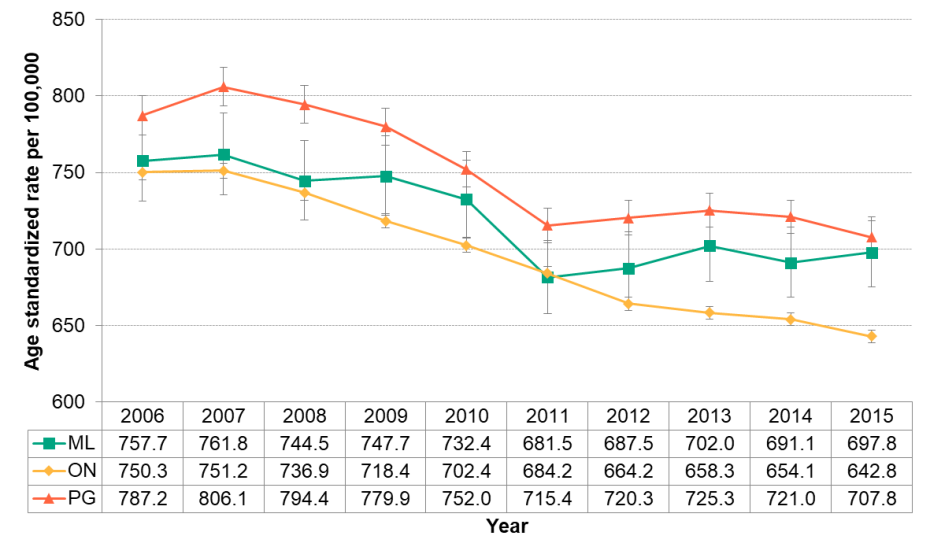
Figure 3.3.3: All-cause mortality by year
Age-standardized rates per 100,000 population, Middlesex-London, Ontario and Peer Group, 2006 to 2015

When the population increases and aging of the population are accounted for, there was an overall decline in the mortality rate for Middlesex-London residents in the decade from 2006 to 2015
When the pattern was examined more closely, there was a significant decrease in the age-standardized mortality rate from 2010 to 2011 in Middlesex-London. However, in 2012 the trend reversed and there was a subsequent increase in 2012 and a flattening out of the rate from 2013 –2015
This more recent increase and flattening of the rate in Middlesex-London was in contrast with Ontario’s trend overall which continued to steadily decline beyond 2010. Middlesex-London’s rate was higher in 2013 than Ontario’s rate overall and it continued to be significantly higher in 2014 and 2015. By 2015, Middlesex-London’s all-cause age standardization rate (697.8/100,000) was substantially higher than Ontario’s overall (642.8/100,000) and was similar to rates found in Ontario five years earlier.