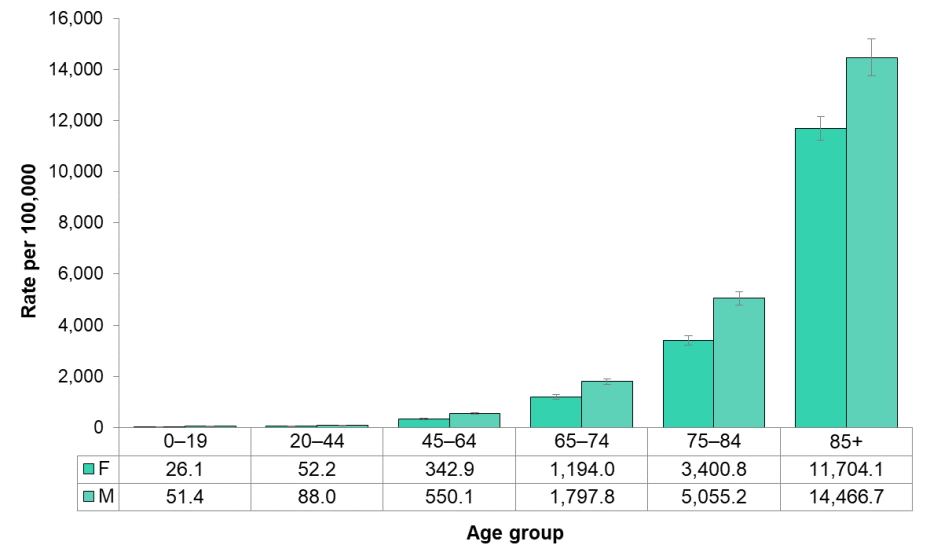
Figure 3.3.2: All-cause mortality by sex and age group
Rate per 100,000 population, Middlesex-London, 2013 to 2015 annual average

Source:
Ontario Mortality Data, Ontario Ministry of Health and Long-Term Care, IntelliHEALTH ONTARIO, Date Extracted: April 26, 2019; Population Estimates, Ontario Ministry of Health and Long-Term Care, IntelliHEALTH Ontario, Date Extracted: May 26, 2018All-cause mortality increased with age for both females and males and substantially increased in the 85+ age group from the rates found in the 75 to 84 age group.
When age and gender specific rates were considered, females had a significantly lower rate than males within each age group.