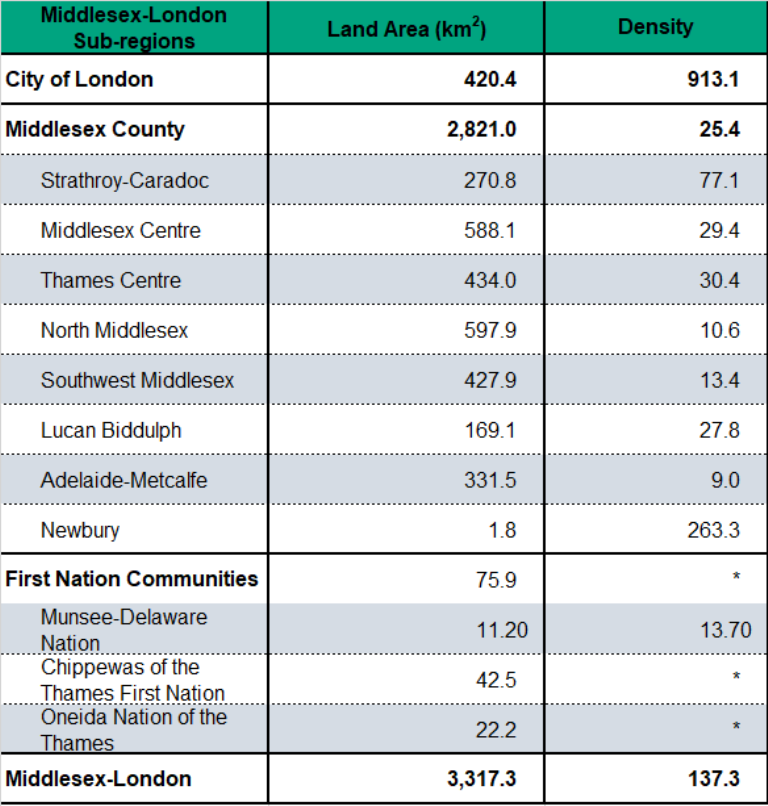
Figure 1.2.2: Population density
Area (square km) and density (population per square kilometer), Middlesex-London and sub-regions, 2016

Source:
Statistics Canada, 2016 Census of Population (Unadjusted)Note:
* The Chippewas of the Thames First Nation and the Oneida Nation of the Thames were among 14 First Nation communities in Canada that Statistics Canada identified were incompletely enumerated on the Census. The band councils did not give Statistics Canada permission to enter their territory. In 2011, the census count for the Chippewas of the Thames First Nation was 762 and for the Oneida Nation of the Thames is was 1,282. The incomplete enumeration accounts for approximately 0.5% of the total population
Population density was 137.3 people per square kilometer overall for Middlesex-London in 2016. This is much higher than Ontario’s average density at 14.8 people per square kilometer.
Population density varied widely by sub-region within Middlesex-London. The most densely population sub-regions of Middlesex-London were the City of London (913.1 people per square kilometre)) followed by Strathroy-Caradoc (77.1 people per square kilometre)