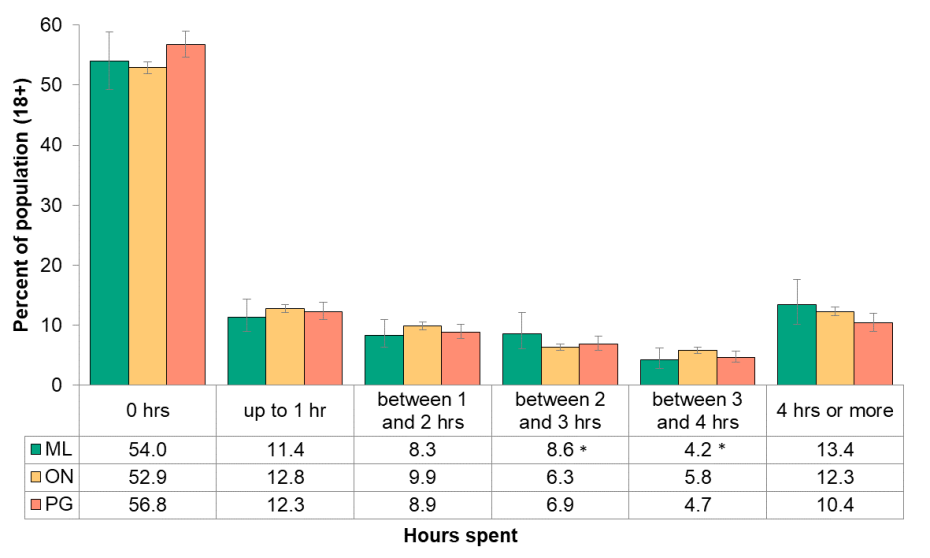
Figure 6.2.8: Total hours of active transportation
Percent of the population (18+) by hours of active transportation in the past week, Middlesex-London, Ontario and Peer Group, 2015/16

Source:
Canadian Community Health Survey [2015-2016], Statistics Canada, Share File, Ontario Ministry of Health and Long-Term CareNote:
*Estimate should be interpreted with caution due to high variability
For adults, 54.0% of the population used no active transportation in the past week when asked on survey in 2015/16.
About 11% used an active transportation method for a duration of one hour, 8.3% for two hours and 8.6% for three hours each in the past week.
These rates were not significantly different than the provincial or peer group rates.