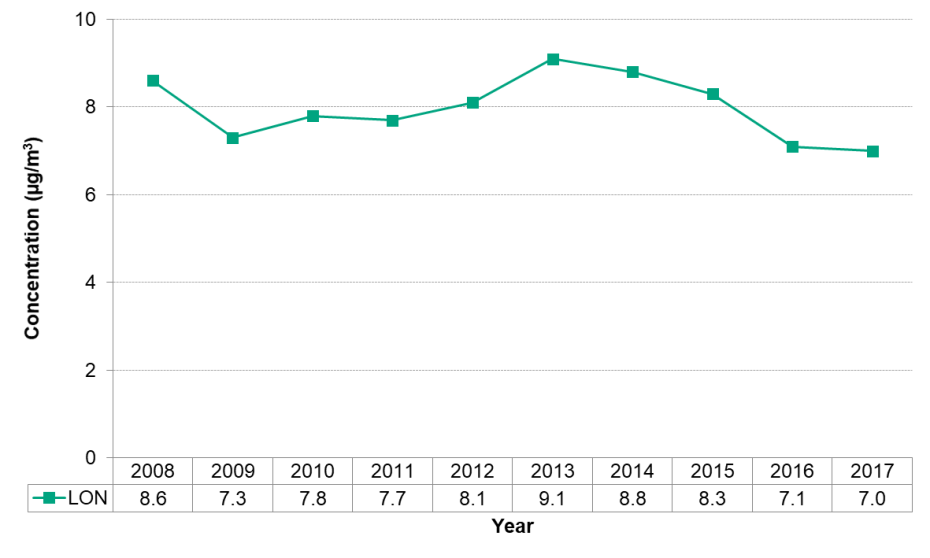
Figure 14.1.1 Fine particulate matter annual average concentration
Fine particulate matter (PM2.5) annual average concentration (µg/m3) by year, London, 2008 to 2017

Source:
Ontario Ministry of the Environment, Conservation and Parks. Air quality in Ontario 2017 Report [Internet]. Toronto (ON): Queen’s Printer for Ontario; 2017 [updated 2019 Jun 20; cited 2019 Oct 28]. Available at https://www.ontario.ca/document/air-quality-ontario-2017-reportNote:
In 2013 a new method to measure PM2.5 was implemented in Ontario. An approximate correction factor has been applied to data from 2008 to 2012 to be comparable to data from 2013 onwards.
Between 2008 and 2017, the annual average concentration of fine particulate matter in London fluctuated between 7.0 and 9.1 µg/m3.
Since 2013, the annual average concentration of fine particulate matter consistently decreased each year.